Some mixed news from the National
Snow and Ice Data Center (NSIDC) provides us with a preliminary update on the
Arctic sea ice conditions for the winter of 2013 and a foreshadowing of what the summer might bring to the Arctic.
Scientists at NSIDC estimate that the Arctic sea ice reached its
maximum extent on March 15, 2013, the date that marks the beginning of the 2013
ice melting season. The maximum areal extent reached 5.84 million square
miles or 15.13 million square kilometres, 283,000 square miles or 733,000
square kilometres below the 1979 to 2000 average areal extent. This is
the sixth lowest maximum sea ice extent since the satellite record began.
It also continues a streak of the 10 lowest maximums all of which have occurred in the last 10 years.
Here is a map and a graph showing the Arctic
ice extent this winter and the areal extent over the past five winter seasons and the average for the period
from 1979 to 2000:
This past winter, Arctic sea ice
extent grew by a record 4.53 million square miles or 11.72 million square
kilometres. Before we pat ourselves on the back, here's what happened
last summer:
On September 16, 2012, Arctic sea
ice reached its minimum extent of 1.32 million square miles or 3.41 million
square kilometres, the lowest seasonal minimum sea ice extent in the satellite
record which goes back to 1979. This was 1.32 million square miles or
3.43 million square kilometres below the average between 1979 and 2000.
The larger than normal areal extent of open water forms a feedback into
the environment; more open water means that there are larger transfers of heat
from the open water areas to the atmosphere which keeps the entire Arctic ecosystem
warmer than usual.
Here is a similar graphic to the one
shown above, showing the Arctic ice extent over the past five summer seasons
and the average for the period between 1979 and 2000:
As I noted above, during the
freezing season of 2012 - 2013, the areal extent of sea ice grew by a record
amount, surpassing the old record by 5.5 percent. Unfortunately, all of
this ice is classified as "first-year ice". Multi-year ice which has been through several freeze-thaw cycles contains much less brine and
more air pockets than first year ice. It is stiffer and is much more
resistant to melting than first-year ice. If first-year ice does not grow
thick enough over the winter period, it will completely melt during the
following summer.
Here is a video from NASA showing how the areal extent of multi-year Arctic sea ice has declined over the past three decades:
It will be interesting to see how
next summer's Arctic ice situation measures up when compared to other years.
With a record low areal ice extent this winter and formation of vast
areas of fragile first-year ice, the globe could once again find itself breaking
last year's minimum Arctic ice extent record.
My apologies
in advance for posting climate-related articles two days in a row, but recent
data from both NASA and the National Snow and Ice Data Center (NSICD) are
intriguing and pretty hard for me to ignore. Both releases show that the extent of Arctic ice has reached
its lowest point in more than thirty years of measuring, an issue that bears
watching.
NASA's analysis of ice coverage shows that on
August 26th, 2012, the areal extent of Arctic ice reached a new generational
low, breaking the previous record set back on September 18th, 2007. What
is concerning about this is that melting is likely to continue for several
weeks yet, suggesting that new records could still be set since the end of the
melt season generally occurs between the middle and the end of September.
Here is a
NASA image showing how this year's ice minimum is far smaller in area than the
average minimum over the period from 1979 to 2010 as shown with the orange
line:
The areal
extent of Arctic ice on August 26th, 2012 was 1.58 million square miles, nearly
2 percent smaller than the previous record low of 1.61 million square miles
reached in September 2007. Scientists have noted that, on average, over
the last thirty years, each decade has seen a 13 percent decline in the minimum
summertime extent of sea ice cover.
NSICD
data shows that over the last six years, the six lowest ice extents
in the satellite record have occurred. Here is a graph showing the
average Arctic sea ice extent over the period from 1979 to 2000 (solid black
line), the extent in 1980 in orange, the extent in 2007 (green dashed line) and
the extent this year (solid blue line):
Normally at
this time of year, sea ice is retreating at a rate of about 15,000 square miles
per day. This year, the extent of sea ice declined very rapidly in early
August and is now retreating at an average of about 29,000 square miles per
day, nearly twice the average.
I realize that
satellite coverage of Arctic ice conditions goes back only three decades,
making it difficult to prove that current changes in ice extent are long term and
irreversible. That said, many scientists believe that the polar regions
act as the "canary in the coal mine" and that the impact of potential
climate changing anthropogenic activities may be reflected first in the Arctic
and Antarctic ecosystems.
Recent
very hot and dry weather throughout much of North America and torrential downpours
in the United Kingdom seem to stir up the mainstream media's coverage of global
climate change. In this posting, I'll take a brief look at a recent update on the National Snow and Ice Data
Center (NSIDC) website. Many scientists feel that the Arctic region will
act like the canary in the coal mine for the global climate situation since it
is the area that will see the most dramatic climate shift.
NSIDC
notes that the extent of sea ice in the Arctic declined quickly in June 2012,
setting record daily lows in the middle of the month and ice loss was particularly
noticeable in the Kara, Bering and Beaufort Seas as well as Hudson and Baffin
Bays. The extent of sea ice is measured using the area of ocean that is
covered by at least 15 percent sea ice. On top of these changes to the
rate of ice melt, snow extent was unusually low in the months of May and June,
part of a repeated pattern of rapid spring snow melt seen in the last six
years.
Here is a map showing the extend of Arctic sea
ice for June 2012:
The
areal extent of sea ice for June averaged 10.97 million square kilometres or
4.24 million square miles. This is 1.18 million square kilometres or
456,000 square miles less than the average over the period from 1979 to 2000 as shown in pink. Based
on the data from those two decades, the ice extent noted on June 30th, 2012
would not normally be experienced until July 21st. The last three years
have seen June ice extent reaching their lowest values since satellite
record-keeping began. The only part of the Arctic region that has seen
the extent of sea ice grow is along the east coast of Greenland.
Here is a satellite composite showing the changes in the extent
of sea ice in September 2008 compared to the median between 1979 and 2008, once again, in pink:
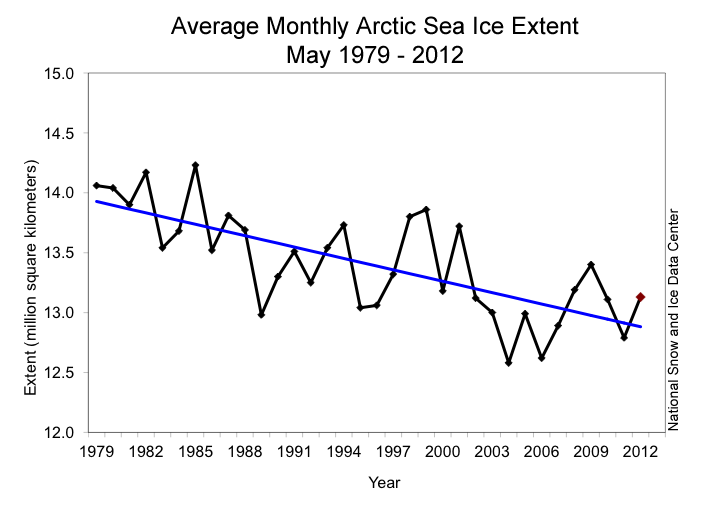
Here is a graph showing the decline in the areal
extent of Arctic sea ice for the month of May since 1979:
On
average, sea ice extent has declined an average of 3.7 percent per decade.
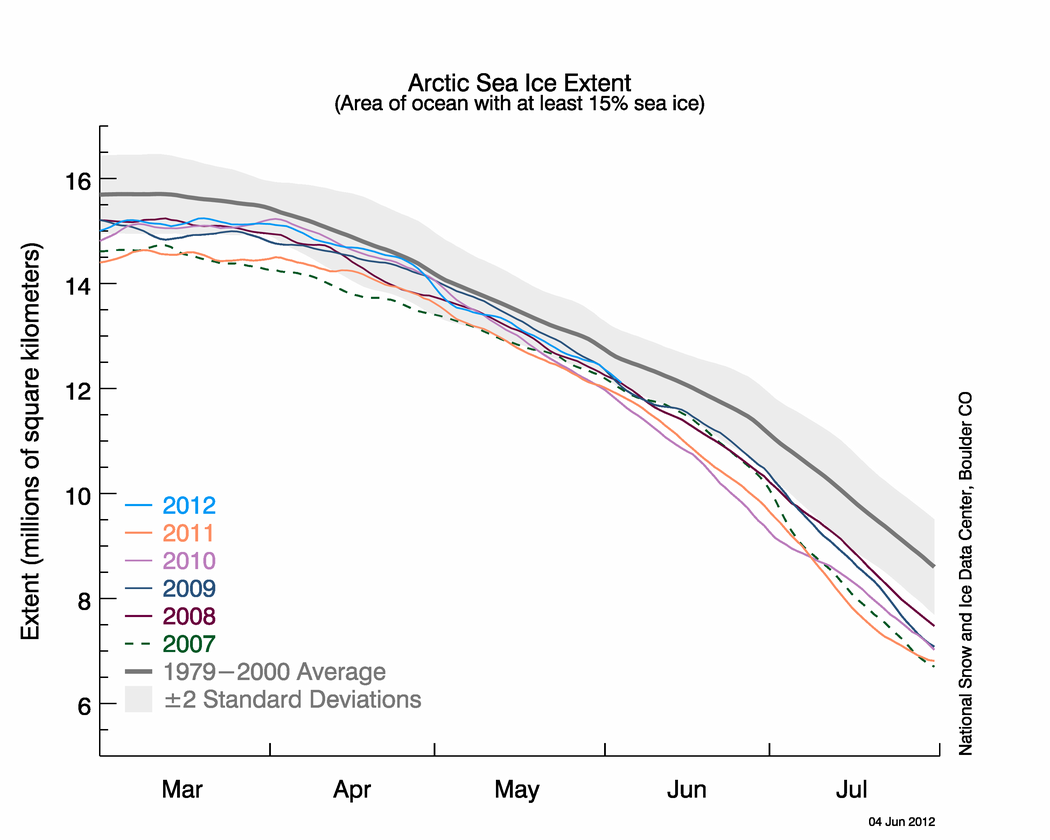
Here is a graph showing the extent of sea ice for
the months of March through July for the years 2007 to 2012 compared to the
median from 1979 to 2000 (in dark grey):
In
June 2012, a total area of 2.86 million square kilometres or 1.1 million square
miles of ice was lost, the largest June melt on record. Air temperatures
at a level of about 3000 feet above the ocean's surface was 1 to 4 degrees
Celsius higher than the 1981 to 2010 average and 7 to 9 degrees Celsius higher
over northern Eurasia and southern Baffin Bay. These warm temperatures,
including a high temperature of 19 degrees Celsius (66 degrees Fahrenheit) on
June 17th and 18th, caused the ice to melt 11 centimetres or 4.3 inches in a 24
hour period.
Not
only is the extent of sea ice declining, this change is being accompanied by
dramatic losses in the area covered by snow. June
2012 set a 45-year record low for snow extent by a significant margin. Snow
extent for June 2012 was 1 million square kilometres or 386,000 square miles
less than the previous record set in 2010. The concept of albedo states that darker coloured exposed land will absorb
more of the sun's energy and will warm faster whereas lighter coloured snow
covered land will reflect more of the sun's energy resulting in slower heating
and resultant melting. Just think how hot a black asphalt roof becomes on
a hot sunny day compared to a lighter coloured surface. Here is a diagram
explaining albedo and how it could lead to more rapid Arctic melting,
particularly since even meltwater-covered surfaces will absorb more of the
sun's energy than snow covered surfaces:
While the weather extremes that we are seeing and the pattern of shrinking Arctic snow and ice cover may be part of
long-term climate change, they may also be reflecting temporary changes in
shorter term weather patterns, unfortunately, we may not know for many years
whether we are truly experiencing a permanent shift in the global climate and
by then, it could well be way, way to late to reverse the process. Unfortunately
for all of us and what particularly concerns me is that our futures lie in the
hands of our elected and terribly ill-informed officials. These non-scientists are using this
very sensitive issue to build their voter base and divide and conquer by splitting
the world into two climate camps rather than actually implementing policies
that could protect our world for future generations.
The
National Oceanic and Atmospheric Administration or NOAA recently released its
annual update to the Arctic Report Card for 2011. This report updates
conditions in the Arctic atmosphere, ocean and land mass, noting changes in
marine ice cover and glacial melting among other issues. Scientists note
that the Arctic acts as the world's "canary in a coal mine" because
changes in climate in the Arctic are amplified compared to what is observed at
lower latitudes where most of humanity lives. Now, let's take a look at
NOAA's findings for 2011.
To
open, it is well worth two minutes of your time to view NOAA's video on the
Arctic Report Card for 2011:
Let's
begin by looking at changes in the Arctic's sea ice. Over the past
decade, sea ice distribution and thickness in the Arctic has changed. The
Arctic sea ice is now both thinner and covers a less extensive area; this has
resulted in both warming and freshening of the upper layer of the Arctic Ocean
waters. In 2011, the summer extent of the sea ice cover dropped by 15 to
20 percent below the 20 year average between 1979 and 2000. In fact, the
minimum Arctic sea ice extent in September 2011 was the second-lowest since
satellite records began in 1979. Here are two maps showing the maximum and minimum sea ice extent for the
months of March 2011 and September 2011 with the magenta line showing the
median maximum and minimum ice coverage:
The
March 2011 maximum ice coverage value was 14.64 million square kilometres; this
is down 7.7 percent from the 1979 to 2000 average. The September 2011
minimum ice coverage value was 4.33 million square kilometres, the second
lowest on record after 2007 and 31 percent lower than the 1979 to 2000 average.
The five summers between 2007 and 2011 have seen five of the lowest ice
coverage values and the 10 summers between 2002 and 2011 have seen nine of the
ten lowest values. Here is a graph showing the gradual percentage
decrease in both maximum and minimum ice extent values since 1979:
The
biggest problem with the melting of sea ice is that it becomes a
self-perpetuating machine. The increased melting is related to the
concept of albedo. Albedo is a unitless
quantity that indicates how well a given surface reflects light, with values
varying between zero and one. Think of it as the whiteness of a surface. A
black surface has an albedo of zero meaning that it absorbs all of the light
energy that hits it and reflects none back. A white surface has an albedo
closer to one meaning that it reflects more (or all) of the incoming light
energy. There are two ways that we can relate to this concept; for those
who live in northern climates, think about how bright it is on a sunny day when
the ground is snow covered. Most of the sun's light is being reflected
back and very little is being absorbed by the snow surface (otherwise, it would
melt very quickly). In contrast, in warmer climates, all you need to
remember is how hot a black asphalt surface gets when the sun hits it. The
asphalt absorbs the sun's light energy and it heats up. Now let's go back
to the ocean. The water in the ocean has an albedo of 0.07 meaning that
it reflects back only about 6 percent of the sun's light energy and absorbs the
remaining 94 percent which causes it to heat up. In contrast, sea ice
without snow has an albedo of 0.5 to 0.7 meaning that it reflects 50 to 70
percent of the incoming light energy and generally absorbs less than half,
meaning that it heats up relatively slowly. Sea ice covered with snow has
an even higher albedo of 0.9; in this case, the snow actually acts as an
insulating blanket for the underlying ice because it absorbs only 10 percent of
the sun's light energy. However, once the snow on the ice begins to melt
and form puddles, the albedo drops and the water begins to warm as it absorbs
the incoming light because it has a lower albedo value. These
shallow puddles have an albedo of 0.2 to 0.4 and can drop as low as 0.15 as the
puddles enlarge. Here is another interesting video from an NOAA
stationary camera showing the melting of sea ice and the formation of ponds on
the ice surface in 2011; each few seconds of the clip is another day:
Notice
how the ice retreats from the foreground? The melting would have
progressed further into the months of August and September but the camera
tipped over due to the melting ice. As the albedo increased, the melting
rate increased.
Now,
back to the NOAA report. Here are a series of maps showing the annual ice
extent minimums for several sample years showing how much the area covered has
declined since 1980 with the median ice extent area outlined in magenta:
The
NOAA also notes that the age of the Arctic's sea ice has changed since record
keeping began. In recent years, there has been greater loss of older
(defined as older than four years), thicker and more resilient to melting ice
(shown in white) as exhibited on these maps:
Note
that the area covered by the oldest sea ice reached a minimum in 2011 when
compared to the previous two years. I'd suggest that this does not bode
particularly well for the future since the younger ice is much less resistant to melting.
Now,
let's take a brief look at the changes in water temperature in the Arctic. The summer of 2011 saw water
temperatures over much of the Arctic Ocean rise well above the mean values
experienced between 1982 and 2006. Warmer temperatures (0.5 to 3.0
degrees Celcius) were noted in the area north of Alaska and Canada and even
warmer temperatures (up to 4 and 5 degrees Celcius) were noted north of western
RUssia and Europe as shown on these maps:
The
sea surface temperatures (SST) in 2011, although above the long-term mean, are
still below the highly anomalous temperatures seen in 2007. Unfortunately,
solar radiation penetrates more easily into the upper ocean as the ice cover
thins, resulting in higher water temperatures, both at the surface and at
depth. In the area to the north of Canada, warmer water temperatures have
descended to depths of around 30 metres.
As
melting increases, the chemistry of the ocean's water changes as well. The
water salinity decreases and becomes fresher as melting of both sea ice and
nearby glaciers occurs. The volume of fresh water in parts of the
Beaufort Sea have increased by 25 percent compared to the 1970s. Not only
has the volume of fresh water increased, there has been a change in the
chemistry of the Arctic ocean water as well. The open waters of the
Arctic Ocean can take up increasing volumes of carbon dioxide resulting in more
acidic ocean water than would be the case if the water was ice-covered. This
is problematic for organisms that form their shells from various forms of
calcium carbonate (i.e. calcite and aragonite) as the level of calcium
carbonate in the water is suppressed and the water becomes increasingly
corrosive. Ultimately, these changes will work their way through the food
chain, impacting the survivability of some organisms leading to additional
stress in the Arctic ecosystem.
I
realize that climate change naysayers will refute the conclusions that follow
these observations but I think that it is important that we use the multi-year observations of NOAA's scientists as another series of data points that will
ultimately lead to mankind doing what is right for the environment and putting
the world's ecosystem ahead of corporate profitability and political gain. There is no
doubt, the Arctic ecosystem is changing; whether it is permanent or not, only
time will tell. Let's hope that it's not too late before the finger
pointing stops and governments act to preserve this world for future
generations.
I have been an avid follower of the world's political and economic scene since the great gold rush of 1979 - 1980 when it seemed that the world's economic system was on the verge of collapse. I am most concerned about the mounting level of government debt and the lack of political will to solve the problem. Actions need to be taken sooner rather than later when demographic issues will make solutions far more difficult. As a geoscientist, I am also concerned about the world's energy future; as we reach peak cheap oil, we need to find viable long-term solutions to what will ultimately become a supply-demand imbalance.


 Posts