Showing posts with label fracking. Show all posts

Tuesday, February 7, 2017

Flaring Natural Gas - An Oil Industry Pastime

Update March 2018

This legislation has now been voted down 49 to 51 in the Senate with three Republicans including Lindsay Graham, Susan Collins and John McCain voting against it.

Back in November 2016, the Obama Administration announced its Methane and Waste Prevention Rule, a final rule that would have ultimately led to a reduction in the release of natural gas into the atmosphere from oil and gas operations on public and Indian lands.  This release is known as flaring, a procedure that is used to burn off what is generally considered to be a low-value product by the oil industry.  

Here is a video showing gas well flaring in the Bakken of the Williston Basin:


Sally Jewell, former Secretary of the Interior, stated that the purpose of the new final rule change was:

"....to prevent waste of our nation’s natural gas supplies is good government, plain and simple.  We are proving that we can cut harmful methane emissions that contribute to climate change, while putting in place standards that make good economic sense for the nation. Not only will we save more natural gas to power our nation, but we will modernize decades-old standards to keep pace with industry and to ensure a fair return to the American taxpayers for use of a valuable resource that belongs to all of us.”

The goal of the final rule was part of the Obama Administration's goal of cutting emissions from the oil and bas sector by 40 to 45 percent from 2012 levels by the year 2025 as well as getting fair value for the flared gas from the oil and gas industry.  To give us a sense of the dimensions of the issue, according to a study by the Bureau of Land Management, in 2014, 375 billion cubic feet of natural gas was flared from federally-controlled and Indian lands, enough to supply the energy needs of 5.1 million households for a year.

The Bureau of Land Management manages more than 245 million acres of surface land and 700 million acres of subsurface rights.  In 2015, production from the 100,000 federally-controlled wells reached 183.4 million barrels of oil, 3.3 billion gallons of natural gas liquids and 2.2 trillion cubic feet of natural gas, accounting for 5 percent of the nation's oil supply and 11 percent of the nation's natural gas supply.  The total production value of the produced oil and gas was in excess of $20.9 billion in 2015 with an additional $2.3 billion in royalties.

The rule change would have been phased in over time with an implementation date of January 17, 2017 and would have seen royalties charged to well operators on the flared gas to ensure a return to American taxpayers.  Royalty rates would have been set at or above 12.5 percent of the value of the natural gas produced.  The BLM estimated that the rule would pose costs to the oil and gas industry of between $114 million to $279 million per year over the next ten years and would produce benefits of between $209 million and $403 million annually.  Interestingly, a 2014 study by the Western Values Project found that the value of flared natural gas flared on federal lands ranged from $427.2 million and $508.6 million in 2013 with between $53.4 million and $63.6 million in federal royalties being lost.  Here is a table showing the volume of flared gas from onshore federal lands and its value going back to 2009:


The rule change was also aimed at protecting the environment since methane is roughly 25 times more potent as a greenhouse gas than carbon dioxide and accounts for 9 percent of all U.S. greenhouse gas emissions with one-third of that amount coming from the oil and gas sector.  The final rule was expected to reduce methane emissions by 35 percent from the 2014 emissions level.

Given all of that background and to little fanfare, the newly minted 115th Congress has changed things.  House Joint Resolution 36 provides for congressional disapproval under Chapter 8, Title 5 of the final rule of the Bureau of Land Management as noted above.   Here is the text of H. J. Res. 36:


Here's how the vote went:


And that puts a very quick end to the Bureau of Land Management's attempt to put an end to natural gas flaring by the oil and gas industry.  Congress certainly doesn't waste time when they have a "bee in their collective bonnets", do they?

Friday, March 20, 2015

Wellbore Integrity and Methane - A Crisis in the Making

Updated July 2017

Back in September 2013, I posting this explanation on one of the key potential problems with fracking.  At that time, I did not have access to data regarding the failure of well bores in areas where there has been substantial horizontal drilling and multi-stage fracking on land.  Thanks to researchers at Cornell, we now have some idea about where the potential problems with shale gas may lie.

First, let's review.  Here, quoting from my posting in September, is an explanation of how a well is drilled, completed and where the problems with well bore integrity can crop up.

When the oil industry drills a borehole to depth, as you can imagine, the sides of the borehole are very unstable and rock continually sloughs into the hole, causing all manner of problems.  To alleviate these problems, a long string of hollow steel production casing of varying diameters is run into the hole to the total depth of the well (or somewhere below or at the depth of the producing formation depending on the type of well).  The diameter of this casing is somewhat smaller than the diameter of the borehole; the space between the walls of the borehole and the outside of the production casing is known as the annulus.   Once the casing is in place, cement is pumped down the casing and flows back up the well between the casing and the sides of the borehole through the annulus.  The cement is allowed to harden and tools are run to ensure that the "cement job" is sound.  The purpose of the cement is three-fold; it holds the casing in place, it prevents the fluids used in the well completion operations from flowing to the surface and it prevents fluids from inside the borehole from flowing into the surrounding formations once the well is completed and on production.  For example, if there is a water-bearing formation above the productive zone, the production casing and cement will seal off that formation, preventing the formation water from flowing into the well bore.

Here is a cross sectional diagram comparing a conventional well bore and an unconventional well bore:


One of the key issues that can cause a completed well bore to fail is related to the cement that is used to fix the production casing in place.  In some cases, the when the cement is pumped down the well bore, it fails to displace the drilling mud in the annulus and in some cases, the cement fails after a period of time.  This failure allows the formation fluids including oil, natural gas or water of varying salinity that are under higher pressure because of the weight of the rock that lies on top of them to flow through the annulus to the surface where the pressure is lower.  It is this problem of well bore integrity that results in contamination of near surface groundwater and the atmosphere.

There are two key differences between conventional natural gas production and unconventional or shale gas production:

1.) Shale gas wells require much higher volume fracks than conventional gas wells.

2.) Shale gas wells require far higher well density than conventional gas wells.

These two factors help explain the potential magnitude of the problem with shale gas production.

Let's switch gears for a minute and take a look at a map showing the extent of the Marcellus Shale play both inside and outside of Pennsylvania:


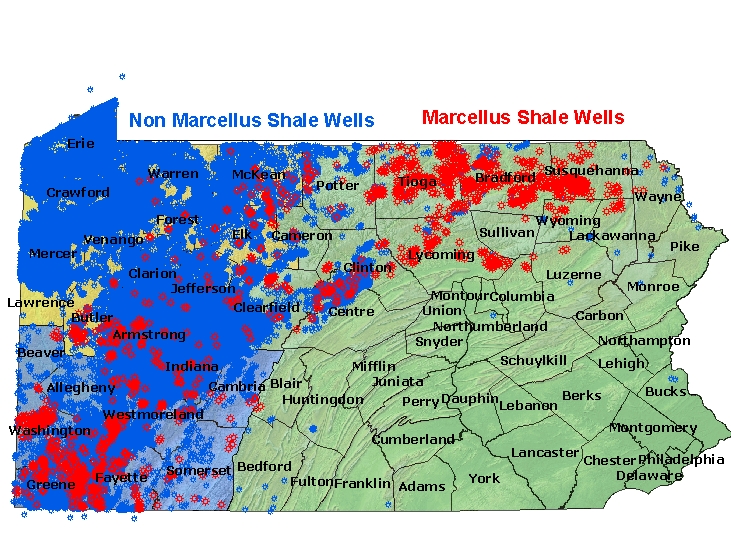
Please note the concentration of Marcellus producing wells in the northeast part of Pennsylvania.

Here is a more detailed map showing the Marcellus shale producing gas wells (in red) in Pennsylvania, again, noting the concentration of Marcellus producers in the northeast part of Pennsylvania:


Now that you have all of that background information, let's look at the study by the Cornell-led research team.  The researchers, Anthony Ingraffea, Martin Wells, Renee Santoro and Seth Shonkoff, examined compliance reports for 41,381 conventional and unconventional (i.e. shale gas) wells in Pennsylvania that were drilled between January 1, 2000 and December 31, 2012.  In total, 32,678 wells were inspected; of these, 26,915 were conventional wells and 5,763 were unconventional.  The majority (92.6 percent) of the unconventional wells were drilled during or after 2009. The objective of their examination was to get complete and accurate statistics of casing and cement impairment, otherwise known as well bore integrity.  Previous studies noted the presence of thermogenic methane which is sourced in deeply buried sediment (i.e as opposed to biogenic methane which is a result of near-surface bacterial activity) in private water wells in Pennsylvania and this study looked to identify the sources of this contaminant.

The authors of the study note that there are many reasons why well bore integrity can fail:

1.) Failed cement barriers because of inappropriate cement density, inadequately cleaned boreholes, premature gelation of cement, excessive fluid loss in the cement, cement shrinking, high permeability in the cement and normal age-related deterioration.

2.) Failed casing because of collapse and corrosion. 

In these cases, fluids can flow from the reservoir at depth to the surface or into aquifers.

In cases where there are leaks that cannot be repaired, Pennsylvania regulations mandate that these wells be permanently plugged and abandoned.  Unfortunately, in many cases, the flow of hydrocarbons and formation waters between zones may still occur, resulting in continued contamination of aquifers and the atmosphere.

Now that we have the necessary background to understand where the problems may lie, let's look at the results of the study.  The authors found the following:


Conventional wells spudded before 2009 had a structural failure rate of between 0.73 percent and 2.08 percent after 2009 in non-northeastern counties of Pennsylvania.  Unconventional wells over the same time periods had a failure rate of 1.49 percent and 1.88 percent.  The differences begin to show up in the Northeast counties of Pennsylvania; in pre-2009 conventional wells, there was a 5.29 percent failure rate and a 2.27 percent failure rate after 2009.  Unconventional wells in the same area had far higher failure rates; unconventional wells spudded before 2009 had a failure rate of 9.84 percent and nonconventional wells spudded after 2009 (over 92 percent of the unconventional wells as noted above) had a failure rate of 9.14 percent.
  
Wells spudded before 2009 make up 72 percent of the total wells in the study but only 31 percent of the wells with casing/cement integrity problems.  Of the wells drilled in Northeast Pennsylvania after 2009, unconventional wells are four times more likely to have integrity problems than their conventional counterparts.  The northeast counties (which includes Bradford, Cameron, Clinton, Lycoming, Potter, Sullivan, Susquehana, Tioga, Wayne and Wyoming) make up only 11 percent of the 3030 wells spudded over the time frame of the study but make up 54.7 percent of the state's unconventional wells and 88.8 percent of the wells with cement and casing integrity issues.


The authors conclude that there is a 1.6- to 2.7-fold increase in the risk of well integrity problems in unconventional wells versus conventional well types.  The study predicts that in the Northeast counties of Pennsylvania, the cumulative hazard of well casing or cement failure will exceed 40 percent over the next 25 years.  Keeping in mind that cement and casing integrity usually declines as a well ages, their estimates may not be far from wrong.  Given that over a 100 year period, methane is 21 times as potent as a greenhouse gas when compared to carbon dioxide, the impact of well integrity issues in unconventional wells across the United States and around the world could be very significant in the coming years.

Tuesday, December 9, 2014

Overstated Tight Oil Reserves and a False Sense of Energy Independence

Updated December 2016

An older but still pertinent publication, "Drilling Deeper", by J. David Hughes on behalf of the Post Carbon Institute has proven to be a most interesting resource in this current low-oil price environment.  As a geoscientist, I found this report to be extremely well written and the author's analysis was both compelling and very thorough.  The report looks at the top seven tight oil and top seven tight gas plays in the United States that account for 89 percent of America's tight oil production and 88 percent of shale gas production and then projects when production from those plays will peak and then begin to decline.  It is these plays which have been made viable through the use of multi-stage hydraulic fracturing (aka fracking) that have brought the United States to the position where it is now one of the world's premier oil and natural gas producers.  The author, a geoscientist, then compares his production calculations to those of the Department of Energy's Energy Information Administration (EIA) which gives us a sense of whether or not production from non-conventional shale plays will be robust over the long-term and how long the United States economy can exploit its rediscovered energy independence.  

For those of you that are non-oil industry people, when an oil or natural gas well is drilled, its production gradually declines over time.  The rate of decline can be very steep or it can be very shallow depending on the reservoir.  Here is a well production profile showing what the production history looks like for a typical Eagle Ford non-conventional oil well:


EUR 30 is the total oil recovered from this particular well over a 30 year period, in this case, 228,000 barrels of oil.  You will notice that the decline is quite steep with most of the oil production occurring in the first year to year-and-a-half.  After that, while the well still produces oil, it is at a much lower rate. 

Now, let's look at what happens when we put a number of new wells into the equation as time passes, a typical occurrence as a field is exploited:


If we combine the two, we end up with a chart that shows the how the oil output of a field from all wells varies over time:


Again, we see that production ramps up as the field is developed through the drilling of more and more wells and drops off fairly rapidly as fewer and fewer wells are drilled as the field ages and as each producing well in the field sees its production decline with time.  This is why the decline rate is such an important component of oil production and oil economics.  

Let's open the main part of this posting with this map showing the geographic distribution of tight oil and shale gas plays in the lower 48 states of the United States:
  

Now that you have a bit of oil industry background, let's look at the EIA's reference case forecast of U.S. oil and natural gas production from 1990 to 2040 from its Annual Energy Outlook 2016 (AEO):


As shown on the solid black line, the AEO projects that U.S. crude oil production will rise to 8.6 million BOPD by 2017 and then rise to 11.3 million BOPD by 2040.  Obviously, the EIA is quite bullish on the future hydrocarbon potential of the United States.

Here's a graph showing what happens to domestic production of tight oil and how it impacts imports:


By 2014, the share of imported oil will drop to 7.4 percent compared to between 45 and 60 percent during the 1990s and first decade of the 2000s.

As we all know, the energy business in the United States is increasingly focusing non-conventional or tight oil plays.  Here is a chart showing how the EIA divides future tight oil production among the main plays:


You will notice that the EIA clearly expects both the Eagle Ford and Bakken to form a significant production base for tight oil production in the coming decades with additional relatively significant oil production from the Permian Basin and Austin Chalk.

For the purposes of this posting and to keep it reasonably readable, I am going to focus on the oil side of the equation, in particular the Bakken and the Eagle Ford, the two key tight oil plays.  Here are Mr. Hughes findings:

1.) Current Bakken oil production is approximately 1 million BOPD from 8500 producing wells.  Current Eagle Ford oil production is approximately 1.3 million BOPD from 6100 producing wells.
   
2.) Tight oil production from major plays will peak before 2020 and production will be far lower than the EIA's forecast by 2040.  In the case of the Bakken and the Eagle Ford, the two biggest tight oil plays which now account for more than 60 percent of current domestic tight oil production, production rates in 2040 will be less than one-tenth of the EIA's projections.  As well, production levels from both the Bakken and Eagle Ford will peak in 2017. 

3.) The field decline rate for the Bakken is 45 percent per year and 38 percent per year for the Eagle Ford.  This compares to a five percent annual decline rate for conventional oil fields.  This means that more and more wells must be drilled to maintain field production levels, however, as oil industry geoscientists know only too well, fields are not infinite in size and not homogenous laterally.  Most fields have a core "sweet spot" where reservoir quality is better and hydrocarbon saturation is higher.  Once these areas have been exploited, it becomes harder and harder to maintain production levels through the drilling of additional wells because the reservoir simply isn't capable of producing as much oil.

In the case of the Bakken, here is a most realistic production outcome case that uses three wells per square mile which would see the drilling of an additional 23500 wells on top of the 8500 currently producing oil (in brown) and compares it to the EIA model (in red):


In the most likely rate scenario, peak Bakken production occurs in 2015 at 1.19 million BOPD.  Total oil recovered by 2040 is 6.8 billion barrels, down substantially from the EIA's estimate of 8.8 billion barrels of produced Bakken oil, largely because of steeper production declines.  As well, by 2040, production from the Bakken will be less than one-tenth of that projected by the EIA.  Note that with a 45 percent decline rate, just to maintain current production levels, 1470 wells must be drilled every year or about 17 percent of the current producing wells.  Over the life of the field, the capital required to drill and complete the additional wells totals about $188 billion.

In the case of the Eagle Ford, here is a most realistic case that uses six wells per square mile which would see the drilling an additional 26200 wells on top of the 6100 currently producing oil (in brown) and compares it to the EIA model (in red):


In the most likely rate scenario, peak Eagle Ford production occurs in 2016 at 1.56 million BOPD.   Total oil recovered in 2040 is 7.76 billion barrels, down substantially from the EIA's estimate of 10.8 billion barrels.  This means that by 2040, production from the Eagle Ford will be less than one-tenth of the level projected by the EIA.  Again, it is important to note that just to maintain current production levels, 2285 wells must be drilled each year or about 37 percent of the current producing wells.  Over the life of the field, the capital required to drill and complete the additional wells totals about $210 billion.


Certainly, as the both the author and the EIA note, there are other tight oil plays in the continental United States that will supply oil to the nation, however, the Bakken and Eagle Ford form the foundation of ongoing tight oil production well into the future, particularly since the other major tight oil plays are decades old and have been exploited using tens of thousands of conventional wells.  Unfortunately, as you can see from this analysis, the EIA's overly optimistic forecast could be backing the United States into an energy corner, lulling consumers into a false sense of long-term "energy independence".  It is also important to note the high capital costs involved in maintaining this "energy independence"; if the current low price environment continues for any length of time, the exploitation of tight oil plays will be postponed, perhaps indefinitely, since it was the sustained existence of high-priced oil over the past few years that made these non-conventional plays economically attractive in the first place.

On the upside, as long as the period of low oil prices is not overly lengthy and prices recover to their pre-collapse level, America's tight oil will last a bit longer.