Showing posts with label defense spending. Show all posts

Wednesday, April 12, 2023

Who is Benefitting From Washington's Undeclared War With Ukraine?

Here is the latest announcement from the United States Department of Defense regarding materiel and service support for Ukraine:


This package includes the following:


Additional munitions for Patriot air defense systems;


Additional ammunition for High Mobility Artillery Rocket Systems (HIMARS);


155mm and 105mm artillery rounds;


120mm mortar rounds;


120mm and 105mm tank ammunition; 


25mm ammunition;


Tube-Launched, Optically-Tracked, Wire-Guided (TOW) missiles;


Approximately 400 grenade launchers and 200,000 rounds of ammunition;


11 tactical vehicles to recover equipment;


61 heavy fuel tankers;


10 trucks and 10 trailers to transport heavy equipment;


Testing and diagnostic equipment to support vehicle maintenance and repair;


Spare parts and other field equipment.


In contrast to the Presidential Drawdown which delivers equipment that is removed from current Department of Defense stockpiles, the Ukraine Security Assistance Initiative or USAI is an authority under which the United States procures military equipment from the defense industry.  As such, the announcement of this particular USAI package represents the first stage of a contracting process to supply materiel to Ukraine's Armed Forces.  This most recently announced package which will use $2.1 billion in USAI funds includes the following:


Additional munitions for National Advanced Surface-to-Air Missile Systems (NASAMS);


Nine counter-Unmanned Aerial System 30mm gun trucks;


10 mobile c-UAS laser-guided rocket systems;


Three air surveillance radars;


30mm and 23mm anti-aircraft ammunition;


130mm and 122mm artillery rounds;


122mm GRAD rockets;


Rocket launchers and ammunition;


120mm and 81mm mortar systems;


120mm tank ammunition;


Javelin anti-armor systems;


Anti-armor rockets;


Precision aerial munitions;


Approximately 3,600 small arms and more than 23,000,000 rounds of small arms ammunition;


Seven tactical vehicles to recover equipment;


Eight heavy fuel tankers and 105 fuel trailers;


Armored bridging systems;


Four logistics support vehicles;


Trucks and ten trailers to transport heavy equipment;


Secure communications equipment;


SATCOM terminals and services;


Funding for training, maintenance, and sustainment.


As you can see from this map from the Kiel Institute for the World Economy, the United States leads the pack of nations that have supported Ukraine with total commitments of $47.07 billion in military aid and total aid (including humanitarian and financial) of $77.71 billion which puts them in tenth place when measured in terms of percent of GDP:


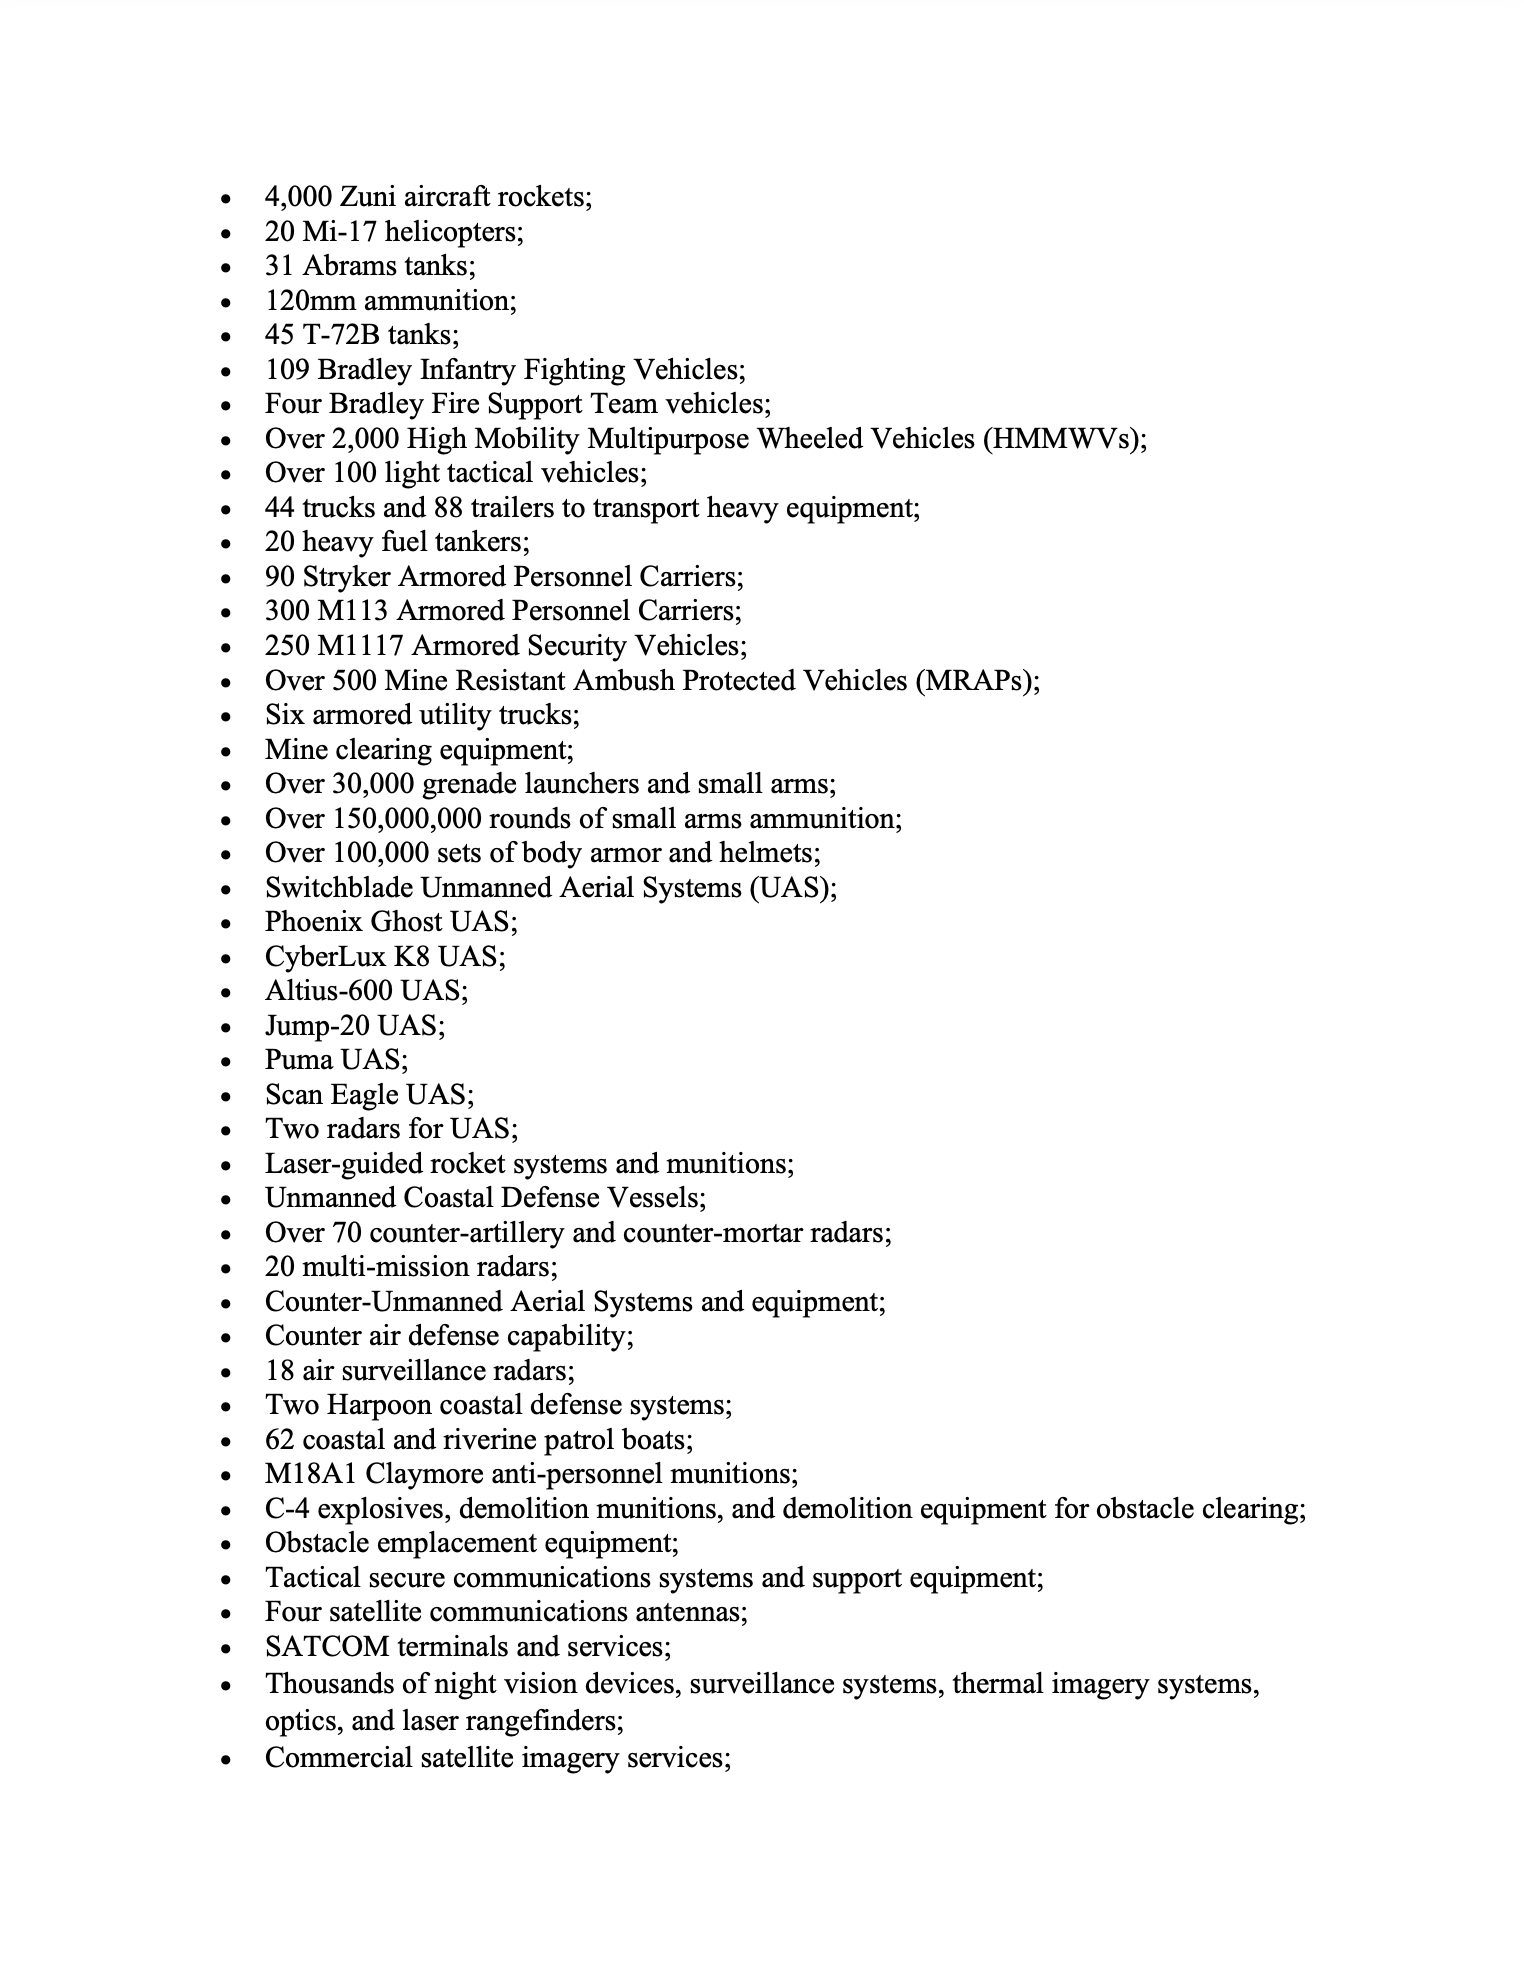
In it's latest iteration dated March 20, 2023, the Department of Defense has provided the following security assistance to Ukraine:


Now, you might ask yourself who is this really benefitting?  Here's an idea of some of the beneficiaries of Washington's undeclared war with Russia:


1.) Lockheed Martin:


2.) Raytheon:


3.) General Dynamics:


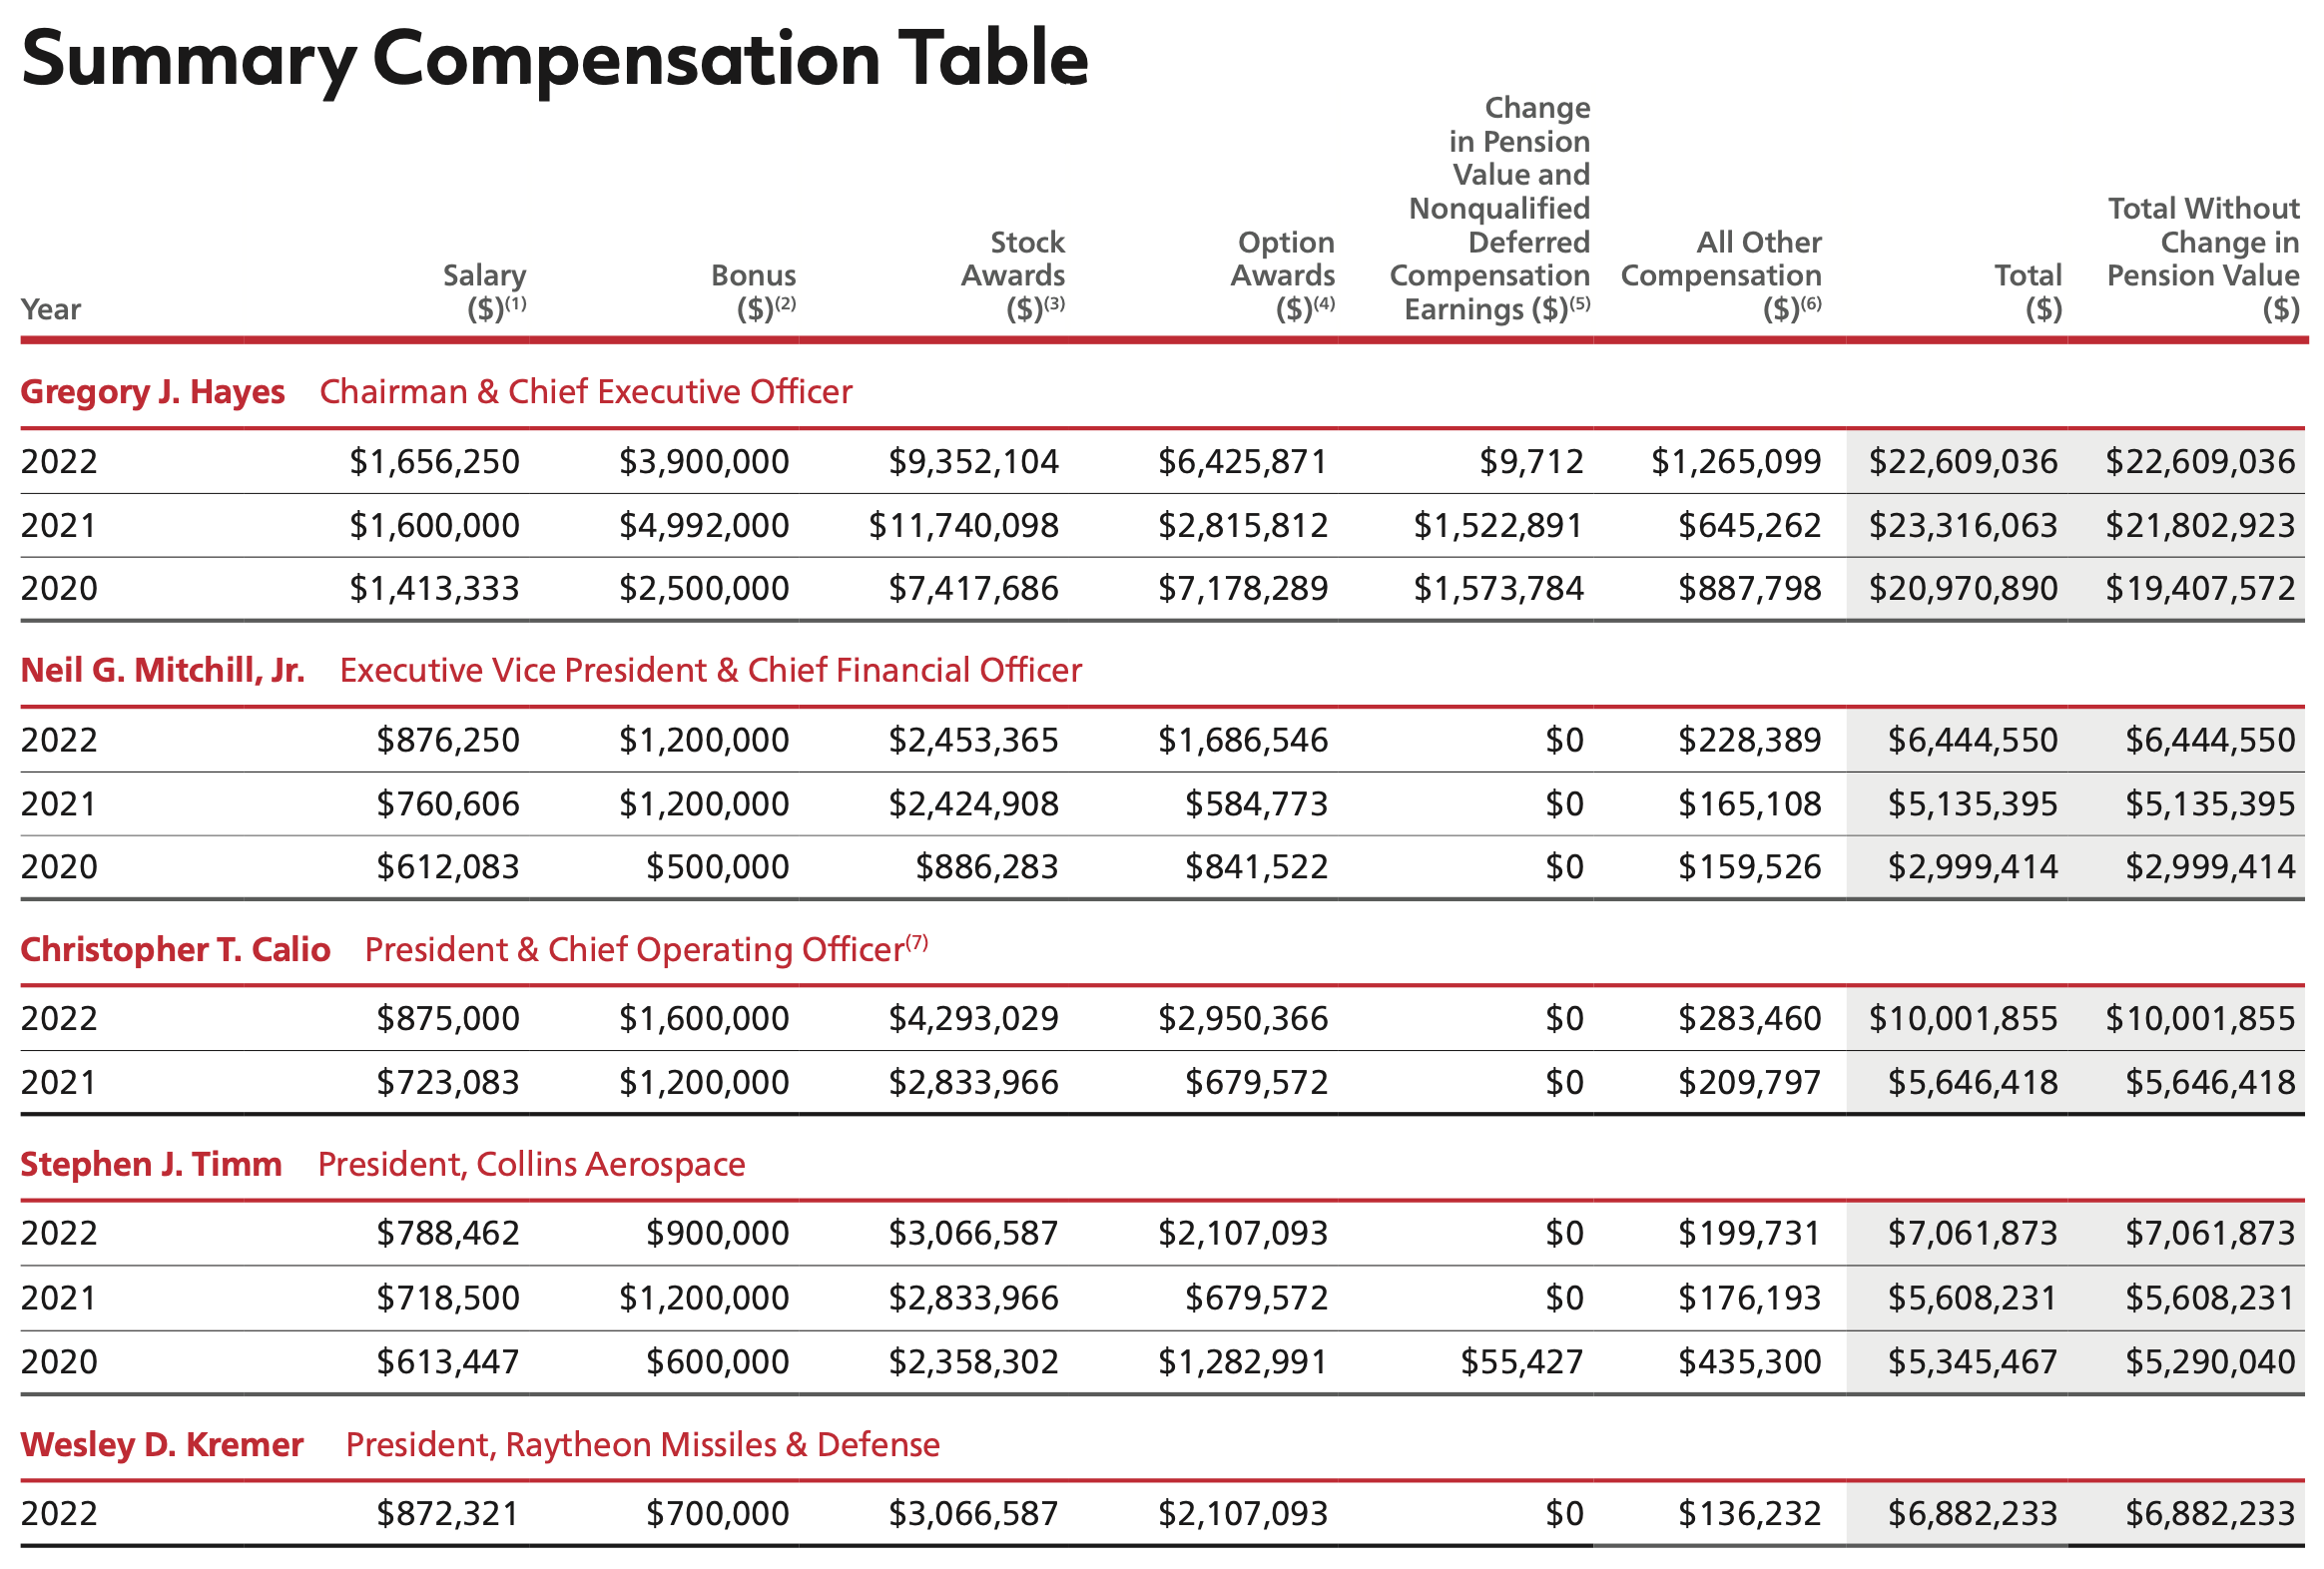
As we all know from history, every war has its winners and losers.  In this war, the United States defense contractors are, at this point in time, the only winners with the upper floor corner office dwellers experiencing this thanks to the unfettered generosity of American taxpayers:


1.) Lockheed Martin:


2.) Raytheon:


3.) General Dynamics:


Certainly, all shareholders have benefitted to some extent from Washington's undeclared war with Russia, however as George Orwell stated in his novel Animal Farm, "All animals are equal, but some are just more equal than others."  And, let's not forget that the materiel drawn down from the Department of Defense stockpiles will have to be replaced, meaning that this war could go on far longer than the actual conflict as far as American taxpayers are concerned.


Friday, July 22, 2022

How Much Does the United States Military Cost American Taxpayers?

With the current conflict in Ukraine in mind and Congressional leaders' insistence that Washington must arm Ukraine to fight against Vladimir Putin at all costs, a recent study by the Institute for Policy Studies (IPS) is particularly pertinent as it gives American taxpayers a sense of how much they are paying to the defense sector and how the funding of the military-industrial-intelligence complex compares to what Washington is spending on other important items.


Let's start by looking at IPS's "State of Insecurity: The Cost of Militarization Since 9/11" report.  The authors of the report included the following as part of America's military expenses:


1.) Department of Defense expenditures


2.) Department of Energy's nuclear weapons activities


3.) Intelligence expenditures including the Central Intelligence Agency


4.) International military assistance


5.) Military retiree/veterans' benefits 


6.) Most programs in the Department of Homeland Security excluding FEMA.


7.) Federal law enforcement programs


All data is sourced from the Office of Management and Budget budget authority data and are inflation-adjusted to fiscal year 2021.


Between fiscal year 2002 and 2021, the following military spending took place (in 2021 dollars):


Department of Defense - $14.14 trillion


Military retirement and other programs - $1.27 trillion


Nuclear weapons programs - $460 billion


Aid for foreign militaries - $267 billion


CIA and other intelligence - $28 billion


This results in total military spending of $16.26 trillion over the two decade period after September 11, 2001.  


Here is a graphic showing how military spending has grown (in constant 2021 dollars) since the mid-1970s and how it continues to remain at elevated levels:


Let's look at a breakdown of spending by the Department of Defense.  More than 70 percent or $9.9 billion of the Pentagon's spending over the past two decades was for operations, purchasing, research and development. Breaking this down further, operations and maintenance spending on operating, deploying and maintaining weapons including ships and aircraft plus training totalled $5.7 trillion.  Procurement costs which include purchasing and upgrading major weapons systems totalled $2.8 trillion.  Compensation for military personnel accounted for $3.3 trillion in spending, noting that the entry-level pay for an enlisted service member in 2021 was the equivalent of a $10.30 hourly wage.  The three biggest beneficiaries of Washington's military generosity over the two decades were Afghanistan at $91 billion, Israel at $57 billion and Iraq at $36 billion; these three nations accounted for nearly 70 percent of all military assistance over the period.


It is also important to note that around half of the Pentagon's budget goes directly into the pockets of the defense industry.  Over the last 20 years, the defense industry took in more than $7.2 trillion in taxpayer-funded purchases compared to only $4.7 trillion in the 20 years before that which, as you may recall, included the peak years of the Cold War.


Now, let's look at another analysis, again by the Institute for Policy Studies which looks at some tax facts for American taxpayers.  Here is a summary of their findings and how Washington's military spending compares to its other spending:


1.) the average taxpayer contributed about $2000 to the military in 2021 with almost half of that amount ending up in the pockets of corporate military contractors.


2.) the average taxpayer paid $929 just for Pentagon contractors in 2021 compared to $171 for Kindergarten to grade 12 education.


3.) the average taxpayer paid $62 for nuclear weapons compared to $27 for the Centers for Disease Control and Prevention.


4.) the average taxpayer paid $62 for deportations and border control compared to $5 for renewable energy.


5.) the average taxpayer paid $18 for federal prisons compared to $7 for anti-homelessness programs.


As you can see from this data, Washington's spending on the military since September 11, 2001 has been profligate when compared to spending on the other key needs of society.  As I noted in this posting, the defense industry is well aware that Washington is for sale and the corner office dwellers in the military-industrial-intelligence community are well aware of that fact and have been in a long-term buying mood.


Monday, September 27, 2021

Post 9/11 Spending by the Pentagon

In a recent posting, I looked at the high budgetary and human costs of the 20 year-long War on Terror.  Once again, thanks to the Watson Institute, we have access to research which shows how profitable the war has been for the defense industry.  Let's look at some of the highlights of the report.


Since the beginning of the War on Terror in the fall of 2001, there have been dramatic increases in funding for the Pentagon as shown on this graphic:


The trillions of budgetary dollars have found a nice, cozy home in the pockets of America's defence contractors.  Companies have three main ways to benefit from the ongoing war economy:


1.) supplying weapons


2.) private security contracting


3.) logistics and reconstruction


The surge in defense spending began immediately after the attacks on September 11, 2001 with the Pentagon's budget (base budget plus the Overseas Contingency Operations (OCO) account increasing by over 10 percent in the first year after the attacks and the beginning of the war in Afghanistan followed by incra succession of year-over-year increases for and unprecedented 10 years in a row.  Spending by the Pentagon peaked in 2010 at over $800 billion in 2021 dollars, its highest level since World War II, rising by nearly one-third over the period from 2001 to 2010.  As well, the increase in the Pentagon's spending between Fiscal 2002 and Fiscal 2003 was more than the entire military budget of any other nation including Russia and China.


Since Fiscal 2001, total Pentagon spending for all purposes reached $14.1 trillion (in 2021 dollars) with $4.4 trillion being spent on weapons, procurement and research and development, categories that directly benefit the defense industry.  The remaining funds of $9.7 trillion were spent on pay and benefits for military and civilian personnel and expenditures required to operate and maintain the United States military.


Let's go back to the $4.4 trillion that was funnelled to the U.S. defense industry.  One-quarter to one-third of all Pentagon contracts in recent years have gone to five major weapons contractors; Lockheed Martin, Boeing, General Dynamics, Raytheon and Northrop Grumman.  From Fiscal 2001 to Fiscal 2020, these five companies split $2.1 trillion (in 2021 dollars) worth of contracts between them.  


Here is a table showing the total value of the contracts issued to these five companies for Fiscal 2020 and Fiscal 2021 alone:


These five companies supplied most of the combat aircraft, attack and transport helicopters, armoured vehicles, bombs and missiles used in both Afghanistan and Iraq.  In total, between Fiscal 2001 and Fiscal 2010, the pentagon spent more than $1 trillion on weapons and services (including the purchasing of an entirely new generation of armoured vehicles) with nearly 25 percent of that spending sourced from supplemental funding which was intended to support the war efforts in Afghanistan and Iraq.  A 2016 study by Action on Armed Violence found that the Pentagon had also issued contracts for $40 billion worth of guns and ammunition between September 2001 and September 2015 which included the provision of 1.452 million guns to Iraq and Afghanistan as shown here, noting that the DoD is unable to account for hundreds of thousands of guns that it sent to both nations, including 190,000 AK-47s:


One other significant area of spending was associated with the increasing use of private military contractors which supplied the Pentagon with logistics and reconstruction.  Given the chaos present int eh war zone, the massive volume of funding supplied by the Pentagon and the lack of government oversight, an environment which enabled massive fraud, waste and abuse was created.  One of the largest suppliers of contractors was Halliburton through its Kellogg, Brown and Root (KBR) subsidiaries.  KBR received an opened arrangement from the Pentagon's Logistics Civil Augmentation Program to coordinate support functions for troops in the field including setting up military bases and supplying them with food and laundry services to maintain equipment.  These contracts grew ten-fold between Fiscal 2002 and Fiscal 2006 and by August 2009 the company had received over $30 billion in funding from the PentagonA December 2003 report showed that KBR had overcharged the Pentagon by tens of millions of dollars for fuel.  In addition, the Director of the Defense Contract Audit Agency  testified in 2009, that after auditing $1.2 billion in Diining Facility Costs from KBR, that he took exception to approximately $352 million of the total because KBR was billing the Pentagon for meals that were not actually provided.  Other companies were also guilty of price gouging; the International Oil Trading Company which received $2.7 billion worth of contracts to supply fuel was found guilty of overcharging the Pentaong for fuel it brought into Iraq which netted a profit of #200 million on sales of $1.4 billion between 2004 and 2008, one-third of which went to its owner, Harry Sargeant III who just happened to serve as the finance chairman of Florida's Republican Party.


Here is an interesting example of another company that "played the game":


Other examples include:


1.)  a U.S.-appointed economic task force that spent $43 million on a gas station that was never used, another $150 million on lavish living quarters for U.S. economic advisors, and $3 million for patrol boats for the Afghan police that were also never used


2.) a Congressional investigation found that a significant portion of $2 billion worth of transportation contracts to U.S. and Afghan firms ended up as kickbacks to warlords, police officials, or payments to the Taliban, sometimes as much as $1,500 per truck, or up to half a million dollars for each large convoy of 300 trucks.


Let's close with this quote from the paper's recommendations:


"Reining in excess profits for weapons contractors, preventing waste, fraud and abuse, and increasing transparency and accountability over private firms involved in conducting or preparing for war involves three major types of initiatives.


1.) reduce spending on war and preparations for war in line with a more modern, realistic defense strategy. A new strategy should increase the role of diplomacy, focus on emerging and persistent non-military security challenges, and reduce direct and indirect foreign military interventions of the type the United States has engaged in Iraq, Afghanistan, Syria, Somalia, Yemen and so many places beyond. The Center for International Policy’s Sustainable Defense Task Force has outlined an approach that could save over $1.2 trillion over the next decade by adopting a more realistic approach to the challenges posed by Russia and China; relying more on allies to address security risks in their own regions; pursuing diplomatic solutions to actual and potential nuclear proliferation in Iran and North Korea; rolling back the Pentagon’s $1.7 trillion, three decade long nuclear rearmament program; and cutting excess bureaucracy, including reducing the Pentagon’s employment of over 600,000 private contract personnel


2.) more rigorous monitoring and regulation of spending including strengthening the role of inspectors general, auditors, and contracting officers in rooting out corruption and negotiating fair prices with corporate suppliers of everything from spare parts to finished weapons systems; and increasing transparency in Pentagon spending, including getting the department’s financial house in order so that it can finally pass an audit.


3.) measures to reduce the political power of arms manufacturers including reforming public financing of elections and other initiatives to reduce the value of private money in the political process, and curbs on the revolving door between government and industry. Revolving door reforms should include imposing longer cooling off periods between government service and employment in the arms industry, closing loopholes in current laws, and increasing detailed reporting on revolving door employment and the post-government activities of personnel who move from Congress, the Pentagon, and other key agencies to positions in the defense sector.104 In addition, think tanks should be transparent about funding sources and identify potential conflicts of interest tied to corporate donations.


If Washington were really serious about reducing the profiteering from war, it would take steps to reduce the incentive to go to war in the first place but we all know that this is never going to happen given this:


...and this:


Friday, October 26, 2018

The World's Top Arms Companies

With global sabre-rattling reaching levels not seen since the end of the Cold War, research by the Stockholm International Peace Research Institute (SIPRI) gives us a unique view of who benefits from the current pervasive war mentality.  In its Fact Sheet "The SIPRI Top 100 Arms-Producing and Military Services Companies, 2016", SIPRI looks at the global arms manufacturing business and provides us with an interesting look at just how profitable this business is, a fact that should be of great concern to taxpayers everywhere since it is our hard-earned tax dollars that ultimately end up as profits for the defense business.  Here are some of the more interesting facts from this very well researched fact sheet.

According to the authors, the 100 largest arms-producing and military services companies had total sales of $374.8 billion in 2016, a year-over-year increase of 1.9 percent, the first increase since 2010 as shown on this graphic:


This sales growth is attributed to ongoing military operations in various nations including Syria, Afghanistan and Iraq as well as major new weapons procurement programs in some nations.

In the top 100 defense companies we find 63 American and West European companies which account for 82.4 percent of total arms sales for 2016.  Of these, 38 are American and 25 are Western European with companies in the United Kingdom, France, Germany, Sweden, Spain, Poland, Norway, Italy and Switzerland.  A total of 10 companies out of the 100 largest are located in Russia.  Other major defense companies are located in Israel, Japan, India, South Korea, Singapore, Turkey, Brazil and Australia.  It is important to note that there are several China-based arms-producing companies that would be large enough to fit into the top 100, however, there is a lack of accurate data available.  Based on the growth in China's military spending, the authors estimate that at least 9 or 10 Chinese companies would be in the top 100 and 2 would be in the top ten.  It is also interesting to note that over the past 15 years, the same 12 companies have occupied the top ten spots on the ranking, showing how the power in the defense industry is controlled by a few companies; in 2016, the top ten companies accounted for $194.8 billion worth of sales or 52 percent of the total for the year.

Here is a pie chart showing the national share of arms sales by the top 100 companies:


As you can see, American companies are, by a wide margin, the biggest sellers of equipment designed to kill and maim people.

Here is a breakdown of sales by region:

1.) United States: The 38 U.S.-based companies had combined sales of $217.6 billion in 2016, accounting for 57.9 percentage of the overall sales for the top 100 companies.  On a year-over-year basis, sales in 2016 rose by 4 percent, reversing the declines of the past 5 years.  Lockheed Martin, the world's largest arms manufacturer, sold $40.8 billion worth of arms, an increase of 10.7 percent on a year-over-year basis, largely based on its acquisition of Sikorsky.   The authors of the study state that American military services companies have managed to increase sales mainly by acquisitions of smaller service companies that are divested by larger arms manufacturers.

2.) Western Europe: In the top 100, we find 8 British companies which account for sales of $36.1 billion or 9.6 percent of total sales.  Sales on a year-over-year basis grew by 2.0 percent.  BAE Systems, Britain's largest arms dealer, was the largest seller with sales up by 0.4 percent followed by Rolls-Royce which saw sales rise by 4.5 percent on a year-over-year basis.

In the top 100, we find 6 French companies which account for sales of $18.6 billion or 5.0 percent of total sales.  On a year-over-year basis, sales dropped by 0.8 percent mainly due to a slowdown in delivery of Dassault's Rafale combat aircraft.

3.) Russia: The 10 Russian companies listed in the top 100 had sales of $26.6 billion in 2016, accounting for 7.1 percent of the overall sales.  On a year-over-year basis, sales rose by 3.8 percent with sales rising for 5 companies and falling for 5 companies.  United Aircraft Corporation, the 13th ranked company in the top 100 saw arms sales rise by 15.6 percent on a year-over-year basis, the highest growth among all Russian companies in the top 100.

In closing, here is a table showing the key data for the top 20 companies in the top 100:


What I found particularly interesting was the column showing the arms sales as a percent of total sales, particularly for the top 10 sellers.  In seven out of ten companies, excluding Boeing and Airbus, two companies known for their passenger aircraft divisions, and the Thales Group of France which is also known for its space, ground transportation and security divisions, between 61 and 95 percent of sales are related to arms sales meaning that these companies are essentially supported by tax dollars.

Given the world's current state of war in several theatres along with the pre-war posturing by Washington, Tehran and Pyongyang, the global trend in military spending is likely to increase over the coming years, much to the delight of the global military-industrial complex.  Fortunately, there seems to be an endless source of taxpayer funding that keeps the ladies and gentlemen occupying the executive floors of these companies in the lifestyle to which they have become accustomed. 

Thursday, July 12, 2018

NATO Spending - Who is Paying Their Share?

With the global anti-Russia movement well entrenched and with it being the target of NATO, let's look at a document from NATO showing its member states' military expenditures, a factor that is particularly pertinent given Donald Trump's ongoing anti-NATO rants.  

Let's start by looking at the raw military expenditure data for NATO going back to 2010, breaking the expenditures into what was spent by the United States and what was spent by the combination of European member states and Canada:


As you can clearly see, the United States has been responsible for at least two-thirds of NATO's total spending on defence over the past eight years.

Here is a table showing the actual expenditures in millions of U.S. dollars for all NATO member states from 2010 to the present:


It is estimated that, in 2017, the United States defence spending totalled 71.6 percent of total defence spending by all NATO member states.

Here is a graph showing defence spending as a percentage of GDP for the United States compared to European member states and Canada:


Here is a graph showing each member states' estimated defence expenditures as a percentage of GDP and equipment expenditures as a share of total defence expenditures during 2017:


As you can clearly see, at 3.57 percent of GDP and at 28 percent of defence expenditures being for equipment, the United States is well above the respective targets of 2 percent and 20 percent.  All nations outside of Greece, Great Britain, Poland and Estonia spend less that the 2 percent of GDP as you can see on this graphic:


In fact, the median spending on defence as a percentage of GDP by NATO member states is only 1.29 percent (including the United States and the other nations spending above the target).

Let's look at some key NATO nations and their estimated 2017 spending on defence as a percentage of their total economies:

Belgium - 0.9 percent
Canada - 1.29 percent
France - 1.79 percent
Germany - 1.24 percent
Netherlands - 1.15 percent
Norway - 1.62 percent
Spain - 0.92 percent
United Kingdom - 2.12 percent

If we go back in time, we can see that NATO's European member nations and Canada have a long history of spending well less than the 2 percent target as shown here:


We have to go back all the way to 1997 to see the non-U.S. NATO member states spending more than the 2 percent of GDP guideline.  We can also see that the United States spends between two and three times as much (as a percentage of its GDP) on its military than NATO's European member states and Canada. 

Lastly, here is a table showing defence expenditures on a per capita basis for all NATO member states going back to 2010:


At $1896, the United States far outspends all other nations with only Norway (at $1481) even coming close.  Even the United Kingdom, one of the biggest defence spenders, only spends $896 on defence on a per capita basis.

While Donald Trump has focussed on the defence spending aspect of NATO, let's look at a table which shows the total military personnel in each of the member states:


With 1.306 million military personnel in 2017, the United States employed 41.3 percent of all military personnel in NATO.
  
The controversy over NATO funding is not going to disappear any time soon.  With Donald Trump appearing to backtrack on his threat to leave NATO without Congressional approval and NATO's agreement to spend an additional $33 billion on their own defence, the data that I have presented in this posting shows that Europe has simply put a bandaid on a long-term, underspending issue given that the extra spending is only 3.4 percent of the $957 billion that NATO nations spent in total on defence in 2017.