Recent
data releases regarding the state of the job market in the United States have
been sending mixed messages about the economy. The headline U-3 jobless
number seems to be intransigently set above 8 percent and the weekly jobless
claims numbers seem to be bobbing around the 370,000 to 380,000 range as shown
on this graph from FRED:
While
this is well off the highs seen in 2009, it most certainly doesn't look that
healthy when we compare it to the levels seen during past recoveries,
particularly the recovery between 2001 and 2008 when initial claims dropped to
the 300,000 to 320,000 range as shown on this longer term graph:
Whatever
could be the problem? Perhaps the answer lies in the JOLTS data released by the Bureau of
Labor Statistics which shows us the number of job openings available to jobless
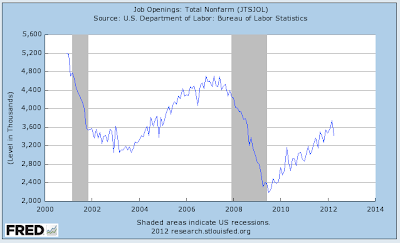
Americans. Here is a graph
showing the total number of non-farm jobless openings from 2001 to the present:
You'll
notice that the number of job openings plummeted from a peak of 4.69 million in
June of 2007 to a low of 2.186 million in July of 2009 during the depths of the
Great Contraction, a drop of 53.3 percent. Since then, the number of job
openings has slowly but surely increased, however, it is still well below the
levels experienced during the period between March 2006 and September 2007 when
it was above 4.4 million every month except two. In fact, the April 2012
level of 3.416 million jobs is reminiscent of the levels seen back in 2004 and
is still between 20 and 25 percent lower than the average just prior to the
Great Recession. It is also interesting to note that the current level is
still well below the levels seen at the beginning of the new millennium
where, during the recession in 2000 - 2001, job openings remained above 3.5
million every month.
As
well, in recent months, the number of job openings seems to have stalled around
the level of 3.5 million which was achieved back in September 2011. What
is even more concerning is the 9 percent month-over-month drop from 3.741
million in March 2012 to April's 3.416 million level.
Where
are/aren't these job openings?
Nope,
no particular improvement in the government jobs' picture.
Very few job openings in that sector too, particularly when one considers that during peak
periods, between 240,000 and 260,000 job openings existed for construction
workers, up significantly from the current level of 80,000.
While
things have picked up significantly since the bottomless pit of the Great
Recession, openings in April 2012 dropped to 246,000, down 20 percent from the
previous month where openings hit a post-recession high of 308,000. Keep
in mind that we must keep this data in perspective; looking back to the early part
of the millennium, manufacturing job openings exceeded 440,000 when this
data was first recorded.
Actually,
this graph
may help explain some of the issues facing those who manufacture things for a
career:
Apparently,
America just doesn't make things any more, either that, or it takes a whole lot
less Americans to make what we actually do consume.
Apparently,
it would appear that the jobs simply are not there, explaining why unemployment
seems intransigent and why some Americans just don't feel like the Great
Recession ever ended. Despite the endless Bernanke Twist'n'Ease, the
employment sector of the economy just isn't firing on all cylinders.


No comments:
Post a Comment