The lengthy and rather
tepid economic recovery since the so-called end of the Great Recession in 2009
is proving to be problematic for the world's central banks, most notably, the
Federal Reserve which has the unenviable position of being the world's lead
central bank. As we now know, the Fed's use of unconventional monetary
policies has been only modestly successful with some key aspects of the United
States economy still under significant negative pressure, particularly
inflation which is below the Fed's comfort zone and the real rate of
unemployment which looks something like this:
A recent speech given by Andrew Haldane, Chief
Economist of the Bank of England provides us with some insight regarding the
issues facing the world's central banks, in particular, the issue of ultra-low
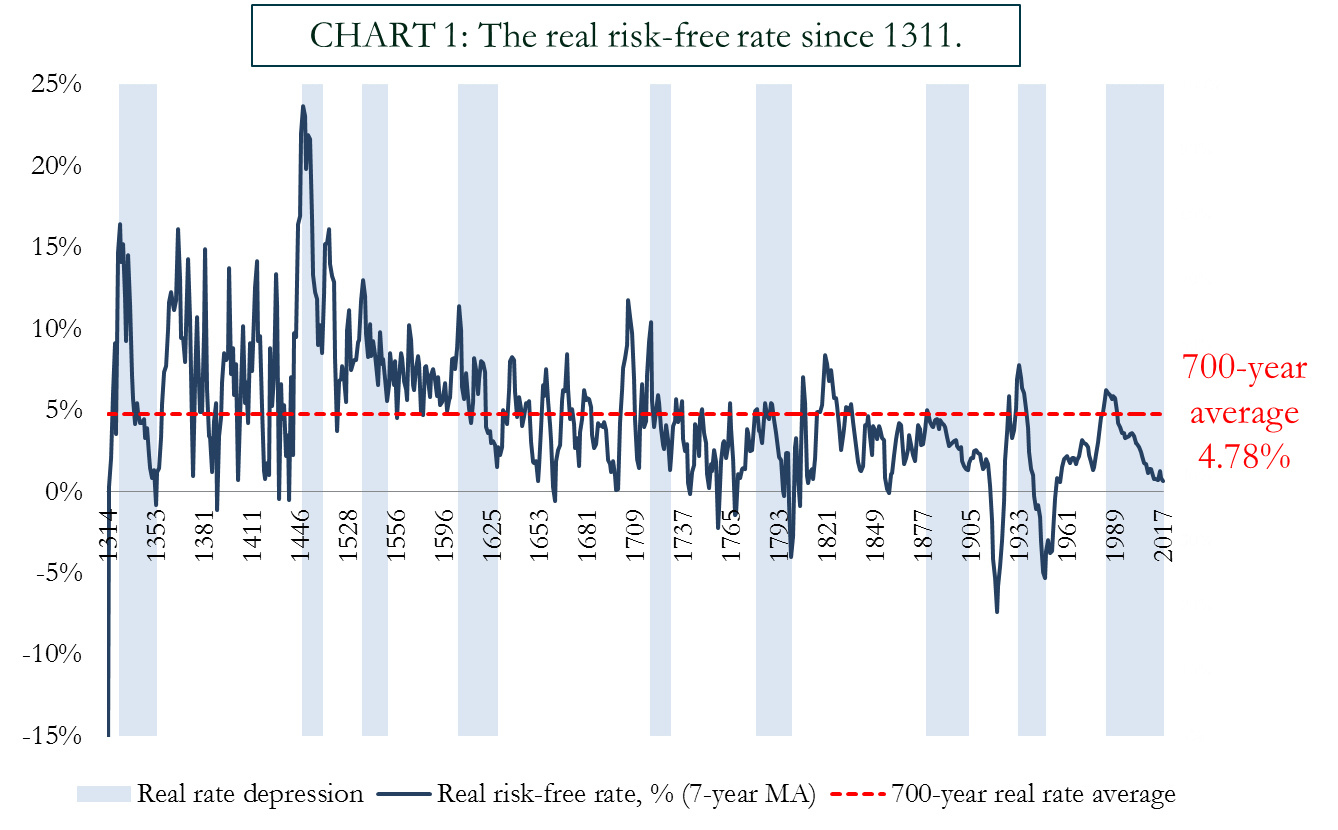
interest rates also known as the zero lower bound or ZLB. As we are all
aware, in the past, central banks have widely used interest rates to enact
their monetary policies; by raising interest rates, they slow down overheated
economies and by lowering interest rates, they speed up economies that are
underperforming. Unfortunately, in the age of the ZLB, this relationship
no longer works since interest rates are and have been around the zero percent
mark for six long years. To give us some perspective of how critical this
issue has become, here is a chart showing global real interest rates since 1980
for both advanced and emerging economies:

In this chart, the red
and blue lines are calculated using the nominal yield on a ten-year sovereign
bond minus the one year ahead inflation expectation. As you can see, back
in the 1990s, real interest rates averaged around 4 percent. With an
inflation target of 2 percent, nominal interest rates averaged around 6 percent
giving central banks plenty of room to maneuver above the zero lower bound.
As the decades past, this interest rate "headroom" slowly
disappeared, leaving central bankers with the dilemma that they face today.
Between 1970 and 1994, a typical interest rate "loosening
cycle" was between 3 and 5 percentage points. Obviously, that cannot
occur today with real interest rates sitting at or just above zero. This
means that central bankers are "out of monetary policy ammunition".
Here is a chart showing
international central bank policy rates since 2000 and the nations that are
included:
The light blue shaded
region represents the world's central banks that have a policy rate ranging
from 0 to 1 percent; right now, 40 percent of the central banks of the nations
that are responsible for 70 percent of the world's have interest rates that
would have practically been unthinkable prior to the turn of the new
millennium. As well, some countries in Europe have short-term interest
rates that are negative. As you can see on this chart, Japan has had an
official interest rate of zero for nearly two decades:
Mr. Haldane goes on to
note that the Federal Reserve, European Central Bank and the Bank of England
have all augmented their traditional monetary policy (i.e. setting of interest
rates to the zero lower bound) with massive QE programmes, injections of liquidity
into the banking system and forward guidance on monetary policies. This
has led to massive bloating of central bank balance sheets as shown here and here:


The need for
unconventional monetary policies arose from a technological constraint, the
inability for central bankers to set negative interest rates on currency whereas
it is possible to set negative interest rates on bank reserves. It is
this inability to set negative interest rates on currency that hinders the
effectiveness of monetary policy because there is an incentive for consumers
and business to switch to currency when interest rates become negative.
This is the key problem of the zero lower bound and the speaker questions
whether the deep roots of the ZLB constraint may be structural (i.e permanent)
or, at the very least, long-lasting.
So, what are the
speaker's recommended solutions to solving the zero lower bound conundrum?
1.) Allow the inflation
target to float upwards. For instance, by raising the inflation target
from 2 percent to 4 percent would allow 2 extra percentage points of interest
rate headroom. The problem with this solution is that the world's economy
over the past three decades has become accustomed to a falling inflation rate
scenario. By deliberately allowing inflation to rise, unforeseen risks
could occur. It may be difficult for the world's central bankers to reign
in inflation once it begins to rise.
2.) Allow unconventional
monetary policy to become conventional. Under this scenario, QE and its
fellow "Twist" would become "a monetary policy instrument for
all seasons". Unfortunately, as shown in the case of Japan, a
lengthy period of QE has proven to be completely ineffective at prodding the
moribund Japanese economy back to life. As well, putting QE on a permanent
monetary policy footing would risk the boundaries between monetary and fiscal
policy which is controlled by governments. If a central bank executes its
QE program by purchasing government debt, this has an impact on the cost of
servicing that debt (which it is supposed to do). If that purchase is
permanent, it has implications for how much debt the government can issue.
Obviously, this scenario would have an impact on "central bank
independence".
3.) Allow negative interest
rates on currency. This scenario involves finding a means to levy a
negative interest rate on currency through a stamp tax which could include
randomly invalidating banknotes with certain serial numbers. It could
also be undertaken by abolishing paper currency or by setting an explicit
exchange rate between paper currency and electronic or bank money. In the
last scenario, paper currency would steadily depreciate relative to digital
money, acting as a negative interest rate on currency. Whether any of
these options would be accepted by consumers is up for debate. The
speaker notes that Bitcoin is a prime example of a digital currency that has
worked and that it could form the template for a new central bank-issued
digital currency, doing away with the need for those nasty old fashioned bank
notes.
"Inflation that
is persistently very low can also be costly, and it is such costs that have
been particularly relevant to monetary policymakers in recent years. The most
important cost is that very low inflation constrains a central bank's ability
to combat recessions. Normally, the FOMC fights economic downturns by
reducing the nominal federal funds rate, the rate charged by banks to lend to
each other overnight. These reductions, current and expected, stimulate
spending and hiring by lowering longer-term real interest rates--that
is, nominal rates adjusted for inflation--and improving financial conditions
more broadly. But the federal funds rate and other nominal interest rates
cannot go much below zero, since holding cash is always an alternative to
investing in securities. Thus, the lowest the FOMC can feasibly push
the real federal funds rate is essentially the negative value of the
inflation rate. As a result, the Federal Reserve has less room to ease monetary
policy when inflation is very low. This limitation is a potentially serious problem
because severe downturns such as the Great Recession may require pushing real
interest rates far below zero for an extended period to restore full employment
at a satisfactory pace. For this reason, pursuing too low an
inflation objective or otherwise tolerating persistently very low inflation
would be inconsistent with the other leg of the FOMC's mandate, to promote
maximum employment." (my bold)
As we can see from both
of these speeches, the world's central banks have backed themselves into a
monetary policy corner. With the world's bond and stock markets dreading
the impact of a minute increase of 0.25 percent in the Federal Reserve's
federal funds rate and with the mathematical likelihood of the next recession
looming, the zero lower bound will prove to be increasingly problematic for the
Federal Reserve, the European Central Bank, the Bank of England, the Bank of
Japan, the Deutsche Bundesbank and their sister central banks around the world.
After all of this, it certainly appears that the Fed (among others) is simply going to raise rates just so that they can lower them again in the future, suggesting that they are concerned about the effectiveness of their experimental policies over the past seven years.


 Posts