Showing posts with label taper. Show all posts

Friday, December 27, 2013

The Bond Volatility Haircut

The Federal Reserve's long experiment with its zero interest rate policy is looking like it is going to wind down over the coming months.  As the Fed withdraws its support from the bond markets, the price of Treasuries is likely to fall and, since interest rates move in the opposite direction to bond prices, the rates on government bonds will rise.  We're already seeing some evidence of that in the fixed income market as shown here:


One year ago, yields on a ten year Treasury note was 1.74 percent.  This has risen to just under 3.0 percent, a rise of 1.26 percentage points or 72.4 percent, a very significant increase on a year-over-year basis.  This is obviously a reflection of the market anticipation of the coming tapering.  On the price side of the equation, if we look back to December 27, 2012, the price for a ten year Treasury note closed at 132.74.  By December 26th, 2013, the price had dropped to 122.98, a decline of 9.76 or 7.4 percent.  That means that holders of ten year Treasuries saw the value of their holdings drop by $9.76 for every $100 worth of Treasuries that they held, a rather significant "haircut" also known as a capital loss.  This is where the problem will lie for those who have invested in market-traded fixed income products whether they hold them in kind or through a bond fund.  What is particularly concerning is the impact on the price of Treasuries down the road as tapering becomes more than just talk.

How bad could the fixed income haircut be?  Thanks to the American Association of Individual Investors, we can get a precise idea of how bond investments will be affected by changes in interest rates in both a rising and a falling interest rate environment.  Here is a chart showing what will generally happen to the price of both a 4 percent and 6 percent coupon bond for bonds with maturities of one, five, ten, twenty and thirty years when interest rates rise and fall by both one and two percentage points:


Here's a brief example showing how the table works.  Assume that you have a bond with a 30-year maturity and a 4 percent coupon.  If interest rates rise by a mere one percentage point, the value of the bond will drop by 15.5 percent, pushing the value of a $1000 bond down to $845.  If interest rates fall by one percentage point, the value of the 30 year bond rises by 19.7 percent to $1197.  If the interest rate rises by 2 percentage points, the value of a 30 year bond with a 4 percent coupon will drop by a very painful 27.7 percent, leaving the holder of a $1000 bond with only $723.  You can see that the longer the bond duration, the bigger the capital gain and capital loss experienced as interest rates fall and rise and the higher the coupon on the bond, the smaller the capital gain and loss since the change in interest rates makes up a smaller proportion of the coupon.  This means that the best way that bond holders can reduce the volatility of their bond holdings in a rising interest rate environment is to reduce the maturity length and increase the coupon interest rate.  You will also notice that the gains are always larger than the losses for the same interest rate change.  That's the mathematics of the relative change in interest rates.  It is this mechanism that has made investors that held bonds during the drop in interest rates since the Great Recession very happy.


The chart above gives us a rough idea of what will happen to the value of our bond holdings as interest rates change in the post-ultra-low interest rate environment.  While the trading price of low-rated (i.e. high yield or junk bonds) will likely be much more volatile (i.e they will fall far faster) than those bonds that are issued by more secure issuers, it is quite apparent that, in any case, there will be rather significant post-taper bond market "haircuts" for many investors, particularly since the impact of even a small interest rate increase on a the price of a low coupon bond is very significant.

Wednesday, December 18, 2013

The Importance of Manufacturing and its Relationship to Tapering

The markets have been all gaga about the recent data coming out of America's manufacturing sector.  The Federal Reserve's data release showed that factory production climbed and that capacity utilization (the amount that a factory is in use) increased to levels not seen since June 2008.  Capacity growth rose by 1.8 percentage points on a year-over-year basis, hitting 79 percent in November 2013.  While this is definitely an improvement over the 2009 low of 66.9 percent, is is not particularly outstanding when taken into historical perspective as shown here:


Capacity is still nearly 1.5 percentage points lower than it was between February 2007 and February 2008 and is well below the 83 percent plus range experienced between 1994 and 1998.  It is particularly mediocre when compared to the 87 percent plus range seen in the late 1960s and early to mid-1970s when America was a manufacturing behemoth.  As well, the current capacity utilization is still down 1.2 percentage points from the 1972 to 2012 average of 80.2 percent and is just above the 78.8 percent nadir experienced during and after the 1991 - 1992 recession.

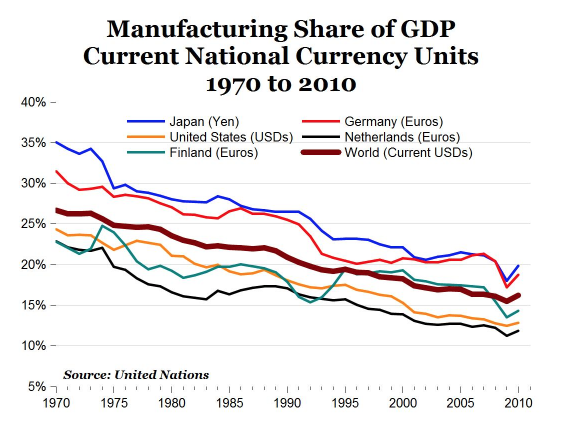
While some "experts" are touting this newfound growth in manufacturing as a harbinger of good things to come from the Federal Reserve, as you can see on this chart, manufacturing is a far less important part of the American economy than just about any time in the last forty years:


In 1970, manufacturing in the United States made up 24.3 percent of the total economy and fell to 12 percent in 2011.  This follows a global trend that has seen the world's manufacturing share of GDP in advanced nations fall from 26.6 percent in 1970 to 16.2 percent in 2010.

The United States Chamber of Commerce seems to feel that this is a good thing and that it merely reflects the shift from a manufacturing intensive "Machine Age" economy to a modern, service-intensive "Information Age" economy.  A study from the Information Technology and Innovation Foundation (ITIF) suggests otherwise.  

The authors of the ITIF study show that between 2000 and 2010, America lost 5.7 million manufacturing jobs or 33.1 percent of the total.  These manufacturing job losses compare to the loss of 30.9 percent of manufacturing jobs between 1929 and 1933.  Here is a graph showing the percentage of job losses for each industrial group within the manufacturing sector between 200 and 2010:


The percentage of jobs lost in the manufacturing sector during the latest recession were the worst since the Second World War as shown on this graph:


Here is a map showing the percentage loss in manufacturing jobs by state for the period from 2000 to 2010:


As well, while the overall change in real manufacturing value-added appears to be growing relative to GDP as shown here:


...many industries are showing output declines with 13 of the 19 sectors that employ 55 percent of manufacturing employees producing less in 2010 than they were in 2000.  Largely, the authors feel that output growth in both the computer and electronic and the petroleum and coal sector being overstated, making the manufacturing sector appear much healthier than it is.

The authors note that, while productivity increases were partially responsible for declining employment in the manufacturing sector, the overriding factor was the decline in output.  If manufacturing output had grown by the same rate as the rest of the business sector between 2000 and 2010, the United States would have 3.8 million more manufacturing jobs than it currently does.

Here is a graph showing the percentage change in manufacturing real value by industrial group for the period from 2000 to 2010:


Notice that the lion's share of growth is in two sectors, petroleum/coal and computer and electronic products with most other sectors showing contraction.  That can hardly be termed "economic balance".  

Now, if we wonder why the manufacturing sector in the United States is failing, here is a graph that may give us the answer:


Perhaps that explains why China now finds that manufacturing now makes up 33.5 percent of its GDP compared to 22 percent in 1970.


I am hoping that all of this data will make you realize that when you read headlines stating that the "health" of the manufacturing sector in the United States is much improved and that this factor will have an impact on tapering, that you will be able to see that, despite the Federal Reserve's intervention since 2008, this once key sector of the economy is on life support and is, unfortunately, relatively unimportant in the grand scheme of what the Fed has planned for the future.

Monday, October 21, 2013

The High Cost of Tapering


Updated May 2014

With the new Federal Reserve Chairperson now in place, there has been quite a bit of tongue wagging about the end of the Fed's seemingly endless program of shoving money down the economy's throat.  Obviously, tapering will have repercussions that will echo through the world's economy and thanks to the IMF's latest Global Financial Stability Report, we have an idea of how costly the end of QE will be.

The authors of the report begin by noting that the interest rate increases since the spring of 2013 have provided a "mini stress test" that has shown where the economy is fragile.  As shown here, the value of bonds over the past year has been quite volatile, dropping over the period from June to the end of September 2013 as rumours of tapering took hold in the world's bond markets:


The signalling by the Fed in May 2013 that improvements in the economy could prompt a sooner-rather-than-later tapering of its asset purchase program sent chills through the fixed income market which had, for years, been propped up by the seemingly endless ability of America's central bank and its fellow central bankers around the world to print and dump money into the economy.  The authors note that "...gradually making the transition to a higher interest rate regime should be positive for financial stability, because risks associated with low rates and the accumulation of financial excesses will be curtailed.  This is especially critical given that some of these risks have continued to build, including the deterioration in corporate credit conditions, yield-seeking behaviour among pension funds and insurers and an extension in portfolio duration.". (my bold)

Currently, the IMF projects an orderly rise in interest rates with an average hike of 381 basis points over 49 months with a total hike of 73 basis points in the first year.  Looking back at historical interest rate hikes, the projected size of the hike in the first year after the beginning of tapering is about one-third of the average of hikes over all Federal Reserve hiking cycles since 1958 as shown on this chart:


Obviously, it is quite possible that an orderly and relatively small (by historical standards) rate hike may not take place.  A sharp and sustained upward move in long-term interest rates could create severe market volatility, particularly if short-term rates rise more quickly, causing heavy losses in portfolios and this could result in forced asset sales which would further depress bond prices and push yields higher.  Although the Fed has tools at its disposal to more easily control short-term rate changes, the same cannot be said for its control of long-term rates.  This is particularly critical given that  in a desperate search for yield, investors dumped trillions of dollars into longer duration bonds of all types as shown on this graph which shows the flow of dollars (trillions) into United States fixed income mutual funds (blue shaded area) versus the flow of dollars into equities (black line):


Note that investments in equities remained relatively constant since 2008 compared to the rapid growth in bond investments over the same time frame.  The total global market value of bonds over the last three historical tightening cycles has been $13.319 trillion; in July 2013, the value hit a whopping $41.541 trillion, a 311 percent increase over historic levels.  The aggregate value of bonds in the United States over the last three historical tightening cycles has been $5.833 trillion; in July 2013, the value hit $16.065 trillion, again, a massive 275 percent increase over historic levels.  These numbers are of great concern since the global bond investment portfolio is now far more vulnerable to changes in interest rates.

On top of that, the global bond market portfolio duration has lengthened substantially since 2008 as shown on the red line for advanced economies and the green line for the United States where the bond portfolio duration has risen from less than 4 years in early 2008 to its current duration of about 5.5 years in mid-2013:


The increase in duration substantially raises the sensitivity of bond portfolios to rising interest rates.  The authors estimate that a 100 basis point rise in interest rates from their current levels will result in a $2.325 trillion loss on global bond portfolios or 5.6 percent of the total value, far more than the losses seen in previous historical tightening episodes.  The loss in the aggregate of United States bonds is estimated to be around $876 billion or 5.5 percent of the total value.  

Only time will tell whether these prognostications by the IMF are correct, however, it is obvious that central bankers are quite unable to predict the ramifications of ending their long and unprecedented  experiment with asset purchases and that the impact of tapering on the economy could be far, far worse than anyone anticipates, plunging the world back into economic crisis mode as the bond bubble bursts.  

Thursday, September 19, 2013

The Marginal Effectiveness of the Fed's Meddling


With the announcement that the Fed is continuing its purchases of securities, largely because of the perception of ongoing weakness in the economy and its concern that tapering could "slow the pace of improvement in the economy and labor market", I thought I'd take a look at just how effective the program has been, particularly when looking back to the previous economic expansion after the 2001 contraction that began in March 2001 and ended in November 2001 and the recession of 1991, admittedly, much shorter and less dramatic corrections than the last one, however, keep in mind that the actions by the Federal Reserve were very muted in those cases in comparison to their current five year program of economic experimentation.  

In case you've forgotten, here is a timeline of the Fed's multiphase "Grand Experiment":


With that as background, now let's look at a selected aspect of a few critical economic indicators; GDP growth, employment, commercial and industrial lending and construction and see how things have improved under the careful and measured guidance of the Federal Reserve and its banking brain trust.

1.) GDP:  Let's start by looking at the percentage change in real gross domestic product from the previous year:


Between the second quarter of 2003 and the first quarter of 2006, real GDP grew by between 3.0 and 4.4 percent after the contraction of 2001.  In contrast, the economy has seen real growth of more than 3.0 percent for only two quarters since the end of the Great Recession, peaking at 3.3 percent in the first quarter of 2012.  The last data point for the second quarter of 2013 shows real GDP growth of only 1.6 percent, slightly above the worst levels seen since the so-called end of the Great Recession.

2.) Employment:  Every week, the Department of Labor releases the Initial Jobless Claims data, one of the most followed economic statistics.  Here is a graph showing the four week moving average of the number of claims since 1990:


After the 1990 recession, it took roughly 18 months for the number of jobless claims to drop to its pre-recession level.  After the 2001 recession, it took three years for the number of jobless claims to drop to the midpoint of its pre-recession level. You will note that over four years after the end of the Great Contraction, the number of jobless claims is now just getting to the midpoint of the pre-Great Recession levels.  That, despite the "heroic" and unprecedented efforts of the Federal Reserve to prod the economy back to life.

3.) Commercial and Industrial Loans:  Here's an interesting graph that we don't normally see showing the value of all commercial and industrial loans by all commercial banks:


While the value of loans is now back in the range of what it was before the Great Recession, it is well below the value seen in the years before the recession in 2001 and about on par with the value seen before the Fed started its wholesale fiddling with the economy.  In fact, given that the Fed's ultra-low interest rate policy was crafted to stimulate borrowing, we can see that it has been quite a failure on that front particularly since this is what the average effective commercial and industrial loan interest rate looks like:


At least QE was successful at one thing.  Unfortunately, it did little good.

4.) Construction:  Now, let's look at one key aspect of the American economy, construction.  The money spent on the building of houses and commercial properties makes up about 5 to 10 percent of GDP.  Here is a graph showing total construction spending since 1993:


The last data point for July 2013 was $900 million, up from the post-Great Recession low of $760 million but just back at the levels last seen in 2003 and well below the pre-Great Recession peak of $1.2 trillion.  Given that interest rates are at multi-generational lows, you would think that investing in new construction, particularly on the non-residential side, would be growing by leaps and bounds, however, as shown here, that is quite clearly not the case:


Even spending on commercial construction looks pathetic and there was no bubble in that aspect of the economy like there was in residential construction pre-2006:


Lastly, it's obvious that with spending on construction down, that this would be the result:


Construction employment is down from 7.7 million before the Great Recession to 5.8 million now, up 7 percent from the post-Great Recession nadir of 5.435 million but down 25 percent from the pre-Great Recession level.  The prolonged low level of employment in construction (i.e nearly 2 million unemployed construction workers) goes a long way to explaining why many aspects of the overall employment situation have shown only modest improvement despite near-zero interest rates. 

With the head of the Fed sort-of admitting that his Grand Experiment has not been a resounding success and therefore, it should come to a quick end, it will be interesting to see how long Mr. Bernanke and his fellow bankers insist on persisting.  After all, the data certainly appears to suggest that, despite the long-term risks taken, it was an experiment that may have bailed the American economy out of the worst case scenario but that it left millions of Main Street Americans are still suffering from the after-effects of the greatest economic debacle of their lives.  

God help us all if the economic recovery gets any "slower" once the Fed lets the free market act like a free market.