Showing posts with label corporate debt. Show all posts

Monday, March 11, 2019

The Next Financial Asset Crisis

A recent publication from the OECD looks at a looming problem for the global economy, a problem that has redeveloped in spite of the lessons taught by the Great Recession.  I have posted on this subject before, however, the recent analysis by the OECD suggests that the economy could be on the cusp of another financial crisis.

Let's open with this table from Investopedia which shows the bond rating systems for both Moody's and S&P/Fitch:


If a company's credit rating falls below a rating of BBB or Baa, the grade of its debt changes from investment quality to junk status.  Junk bonds are the debt of companies that are experiencing financial difficulties which increases the risk to investors as well as the yield that they must offer to entice bondholders to purchase their debt.

In the OECD's Corporate Markets in a Time of Unconventional Monetary Policy, the authors provide a detailed look at the corporate bond world, using a dataset that is comprised of almost 85,000 unique corporate bond issues by non-financial corporations from 114 countries between 2000 and 2018.  They note that since the financial crisis of 2008, non-financial companies dramatically increased their borrowing through the use of corporate bonds; over the decade between 2008 and 2018, global corporate bond issuance averaged $1.7 trillion per year compared to $864 billion in the years up to the financial crisis, a near doubling of the rate of corporate debt accrual.  They also note that the global outstanding corporate debt reached $12.95 trillion, twice as much corporate debt as existed in 2008 when the level of corporate debt reached $6.53 trillion.  Companies from advanced economies hold 79 percent of the total global outstanding amount in 2018, growing from $5.97 trillion in 2008 to $10.17 trillion in 2018.  Companies from emerging economies hold 21 percent of the total global outstanding amount in 2018, growing to $2.78 trillion, an increase of 395 percent over a decade.

Here is a graphic showing the total amount of corporate debt issued on an annual basis between 2000 and 2018:


Here is a graphic showing the total outstanding amount of corporate bonds issued by non-financial companies in 1998, 2008 and 2018:


If we focus on advanced economies, annual non-financial corporate bond issuance rose from $898 billion in 2007 to a recored level of $1.5 trillion in 2017, falling back to $1.2 trillion in 2018.  Looking at developing economies, the situation is even more exaggerated; before 2008, corporate bond issues in emerging markets averaged $70 billion annually, rising rapidly to a peak of $711 billion in 2016.  Even though corporate bond issuance has fallen in emerging markets in 2017 and 2018, it is still 750 percent higher than it was before 2008.  This growth in emerging market corporate debt can largely be attributed to the growth in China's debt as shown here:


In both advanced and developing economies, the number of unique non-financial companies that raised debt using bonds has increased since 2008 as shown on this graphic:


The number of companies in advanced economies issuing new corporate bonds rose from 1,133 in 2007 to 2,327 in 2017.  In the case of developing economies, the number of companies issuing new corporate bonds rose from 347 in 2007 to 1,917 in 2016.  In both cases, the number of new companies issuing corporate debt has fallen in 2018.

Here is a graphic showing corporate bond issuance for both the United States and Europe between 2000 and 2018:


In 2018, corporate bond issuance by American companies made up 35 percent of the global bond issuance compared to 20 percent by European companies.  In the case of American companies, the mean and median size of the bond issuance has risen substantially since the financial crisis:

Years - 2000 to 2007

Mean - $479 million
Median - $273 million

Years - 2008 to 2018

Mean - $837 million
Median -$465 million

One of the concerns expressed by the authors is the quality of the debt being issued.  Here is a graphic showing a breakdown in the credit quality of the bonds with IG being investment grade and Non-IG being non-investment (or junk) grade since 2000:


Here is a graphic showing the share of non-investment (or junk) grade bonds in global bond issuance on an annual basis and the average default rate of rated companies:


Note that the share of non-investment grade bonds plummeted to 7 percent of the total in 2008 and rose very sharply to 34 percent in 2010 and remained above or very slightly below 20 percent from 2011 to 2018.  This is the longest period of time that the share of non-investment grade bonds has remained this elevated before a downturn sets in and default rates rise as they did in 2008 and 2009.

Here is a graphic showing the composition of investment grade bonds since 2000:


As you can see, the percentage of BBB-rated bonds (the cutoff point between investment and junk grade bonds) grew at the expense of higher rated bonds, reaching 53.8 percent in 2018, the highest share of BBB bonds issued going back to 1980.  

Here is a graphic showing the composition of non-investment grade bonds since 2000:


In this case, there is a shift toward higher rated BB bonds whose share rose from 35.2 percent in the period before 2008 to 53.9 percent in 2018.  

Let's close with an examination of the global corporate bond rating index going back to 1980.  The index assigns a score of 1 to a bond if it has the lowest credit rating and 21 if it has the highest rating (there are 21 bond rating categories in total).  Here is a graphic showing how the global bond rating index has fallen over the past 4 decades:


This clearly shows the drop in quality of corporate bond issues over the past 40 years.  Unfortunately, this drop in quality has not been reflected in yield spreads as would be typical, thanks in large part to the Federal Reserve's long term experiment with ultra-low interest rates:

In closing, the author's make the following observations:

"The “amount” of corporate bond investments that may be expected to default in the case of an economic downturn may be considerably larger than that experienced in the financial crisis. This divergence may arise not just because of a prolonged period of low issuer quality… but also because of the increase in the total amount of outstanding corporate bonds from USD 6.53 trillion in 2008 to USD 12.95 trillion in 2018. Due to the lower levels of covenant protection, non-investment grade issuers may indeed escape default for a longer time as it is now less likely that they breach a covenant. Nevertheless, bond investors’ portfolios may be hurt far before the occurrence of a default event, as the expectation of a company’s default and achievable recovery rates will quickly be factored in the bond price."

The authors also note that a financial shock similar to the 2008 crisis could result in $500 billion worth of BBB-rated corporate bonds being downgraded to non-investment grade within a year, forcing sales by non-investment grade investors.  This figure could become even worse if a major issuer in the BBB category saw its credit rating drop, similar to what happened in 2005 to both General Motors and Ford Motor Company.

Corporate bond buyers - caveat emptor.  You have been warned.

Friday, December 21, 2018

The Federal Reserve and the Achilles Heel of the American Economy

In its recent Financial Stability Report, the Federal Reserve looks at the resiliency of the American economy and the key financial vulnerabilities that increase the level of risk for the economy as a whole, most of which are, in some way, connected to higher interest rates.    This "navel gazing" by the Fed is fascinating, particularly given that it was the central bank's policies that led to the financial crisis and near collapse of the global economy between 2007 and 2009.  While the Fed touts its success at reviving the economy since that time through the use of imaginative and untested monetary policies, it notes the following vulnerabilities that may have or already have "built over time":

• Valuation pressures are generally elevated, with investors appearing to exhibit a high tolerance for risk-taking, particularly with respect to assets linked to business debt.

• Borrowing by households has risen roughly in line with household incomes . However, debt owed by businesses relative to gross domestic product (GDP) is historically high, and there are signs of deteriorating credit standards .

• The nation’s largest banks are strongly capitalized, and leverage of broker-dealers is substantially below pre-crisis levels. Insurance companies have also strengthened their financial position since the crisis.

• Funding risks in the financial system are low relative to the period leading up to the crisis . Banks hold more liquid assets, and money market mutual funds are less vulnerable to destabilizing runs by investors 


In this posting, I will focus on the issue of business debt since it is my personal belief that this is the Achilles heel of the American economy.

According to data provided by the Fed, this is what has happened to corporate bond yields for both BBB rated and high-yield (i.e. junk debt) since the mid-1990s:


As you can see, corporate bond yields have been at historical lows since the Great Recession and have only begun to move up during the last half of 2018 as the Fed has pushed interest rates higher.

What is even more concerning is the fact that investors have been lulled into believing that corporate debt is a secure investment as shown on this graphic which measures the spread between corporate debt and supposedly risk-free Treasuries:


What this graphic does not show is the fact that corporate bondholders are willing to extend loans to Corporate America with fewer credit protections to high-risk borrowers, a factor that could prove to be extremely painful to corporate bondholders should corporations start to default on their debt.

Now, let's look at how much businesses have borrowed.  Here is a table showing the breakdown of business credit as well as total private nonfinancial credit (i.e. including household debt of all types) and the growth rates from Q2 2017 to Q2 2018 and the annual growth rate from 1997 to 2018:


Business debt makes up 49.14 percent of all private nonfinancial debt in the United States.  Business debt has grown at 4.5 percent over the past year (measured from Q2) and 5.7 percent annually since 1997.  What is more concerning is the growth in business debt relative to the size of the economy as measured using GDP:


Unlike household debt, business debt is now at historically high levels when measured against GDP.

Here is a graphic showing the issuance of riskier forms of business debt (leveraged loans and high-yield or junk bonds) going back to 2005:


While the issuance of risky debt dropped during 2015 to 2017, it has since picked up substantially and now totals more than $2 trillion.

In addition, credit standards for some business loans have deteriorated over the past six months.  The share of newly issued large loans to companies with high leverage (ratios of debt to EBITDA greater than 6) exceeds levels seen in both 2007 and 2014 as shown here (coloured light brown on the bar graph):


As of the second quarter of 2018, around 35 percent of all corporate bonds outstanding were at the lowest end of the investment-grade group, totalling $2.25 trillion.  Here's what the Fed has to say about this looming problem:

"In an economic downturn, widespread downgrades of these bonds to speculative-grade ratings could induce some investors to sell them rapidly, because, for example, they face restrictions on holding bonds with ratings below investment grade. Such sales could increase the liquidity and price pressures in this segment of the corporate bond market."

Given that, over the past year, firms with high leverage, high interest expense ratios and low earnings and cash holdings have been increasing their debt loads the most as shown on this graphic:


...we can clearly see where the next debt crisis in the United States is likely to occur, particularly as interest rates continue to rise. 

In large part, the looming business debt problem in the United States was created by the Federal Reserve through its extended experiment with ultra-low interest rates.  Unfortunately, a decade of low interest rates have lulled investors who are desperately seeking yield into a false sense of security, believing that a repetition of the Great Recession will never happen and that their investments in junk corporate debt will always retain their value.

Thursday, July 5, 2018

Corporate America's Debt Problem

Updated October 2018

History shows us that economic contractions are never predicted, particularly by central bankers.  One aspect of the economy is growing worrisome and could prove to be extremely problematic during the next recession.

Here is a graph from FRED showing the growth in seasonally adjusted GDP going back to 1947:


Here is a graph showing the growth in non-financial corporate debt going back to 1945:


Now, let's combine the two and look at non-financial corporate debt as a percentage of GDP:


Over the six and a half decades since 1951, corporate debt as a percentage of GDP averaged 18.09 percent.  In sharp contrast, during the second quarter of 2018, corporate debt was 30.44 percent of GDP, just below its all-time high of 31.31 percent in the third quarter of 2017.  Prior to the Great Recession, corporate debt was only 22.2 percent of GDP during 2006; since then, corporate debt as a percentage of the economy has grown by 9.11 percentage points or 41 percent.

Let's look at another aspect of the corporate world, after tax profits, and compare this metric to corporate debt.  Here is a graph showing the growth in profits since 1947:


While that metric of corporate health looks quite good, let's go on to add corporate debt (in red) to the graph showing corporate profits (in blue):


You will observe that there is a substantial and growing divergence between the two key measures of corporate health.

Now, let's subtract corporate profits from corporate debt to show how quickly corporate debt is growing when compared to corporate profits, a phenomenon that I term "the corporate profit-to-debt gap":


In the first quarter of 2018, the corporate profit-to-debt gap reached $4.251 trillion, slightly below its all-time high of $4.452 trillion which was reached in the fourth quarter of 2017.  As well, the corporate debt-to-profit gap has risen by $1.999 trillion or 88.8 percent since its post-Great Recession low.

There is one factor that has created this unsustainable situation for Corporate America as you can see here:


...and here showing the ICE BofAML US High Yield CCC or below effective yield, in other words, the yield on the junkiest of what Corporate America has to offer as debt instruments:


Given the desperate search for yield following the Fed's near-zero interest rate policies of the post-Great Recession period, investors have pushed the yield on even the riskiest of corporate debt to extremely low levels that do not reflect the risk involved.

Thanks to the Federal Reserve, Corporate America has been able to accumulate unprecedented levels of debt that, at least in some cases, will prove to be difficult to service during the upcoming recession when the growth in the profit-to-debt gap and the high level of corporate debt as a percentage of GDP come home to roost.  Unfortunately, investors (and central bankers) won't see the crisis until it's already upon us.

Tuesday, May 30, 2017

Have We Entered the Corporate Debt Danger Zone?

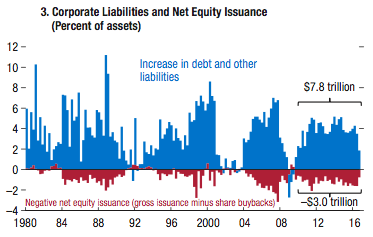
Thanks to the Federal Reserve and its central bank peers, the world is now awash in debt.  This is particularly the case in the corporate sector where debt has been accrued to record levels, an issue that is of concern, particularly when one of two scenarios play out; a rise in interest rates or a slowing of the economy.  In the most recent version of theInternational Monetary Fund's Global Financial Stability Report for April 2017, the IMF takes a detailed look at the global corporate sector debt levels and expresses concerns over the worsening debt serviceability issues.  In this posting, we'll look at the debt situation for the corporate sectors in both the United States and take a brief look at the corporate debt situation in the world's emerging economies.

The IMF begins by noting that the U.S. corporate sector has added $7.8 trillion in debt and other liabilities since 2010 with traditional equity financing being outstripped by share buybacks as you can see here:


Here is a graphic showing how the net leverage (ratio of net debt to EBITDA or earnings before income tax, depreciation and amortization) for big corporations in the United States:


As you can see, median corporate leverage among large corporations has grown steadily since the end of the Great Recession and is now close to historically high levels at 1.5 times earnings.

Here is a graphic showing net leverage for key sectors of the economy, comparing the level in 2004 to 2006 to the level in 2016:


Eight out of ten sectors showed an increase in leverage with only two showing a decrease over the decade; industrials and real estate, although the net debt of these three sectors is still very high.

Here is a graphic showing the debt service burden (red line) for the American corporate sector:


Despite the current ultra-low interest rate environment, the debt service burden for Corporate America has risen substantially since 2015.

Here is a graphic showing interest rate coverage ratios (ratio of EBIT (earnings before income tax) to interest payments):


As you can see, higher interest rates could push the interest rate coverage ratio downwards even further, significantly weakening the ability of corporations to cover interest owing on their debt.

Here is a graphic showing the percentage of firms at risk of default:


At 22.1 percent, the percentage of firms that are at risk of default is at the highest level since the turn of the millennium.

Now, let's take a brief look at the corporate sector debt situation in the world's emerging market economies.  Here is a graphic showing which nations have corporate debt that is at risk (i.e. interest coverage ratio of less than 1) should global trade decline, economic growth decrease and protectionist trade pressures rise:


Corporations in nations that rely heavily on manufacturing and commodity exports are particularly vulnerable to increases in debt risk since they are the economies that will be impacted the most by protectionism as shown here:


As we can see from this report, thanks to the current ultra-low interest rate fantasy land, the corporate sector in both the United States and the world's emerging market economies is highly vulnerable to changes in interest rates, largely because it has gorged itself at the cheap debt trough.  Earnings have dropped to less than six time interest expense, a level that is close to the lowest levels seen during the Great Recession.  While many of these troubled firms are in the beleaguered energy sector, firms in both the real estate and utilities sector are showing debt pressures as well.  Under a scenario where there is a sharp rise in interest rates, the IMF projects that the combined assets of debt challenged American firms could reach almost $4 trillion, a scenario that does not bode well for investors, particularly those that have invested in high yield corporate debt.