In large part, the
negative impact of the Great Recession on the world's economy was amplified by
high debt levels among all levels of government and individuals. One
would think that the very painful but necessary lessons about excessive debt accumulation would have been learned,
however, a study "Deleveraging: What Deleveraging?" by the
International Center for Monetary and Banking Studies (ICBM) and the Centre for
Economic Policy Research (CEPR) suggests otherwise. The study looks at
both private and public debt with private debt broken down into its household,
non-financial corporate and financial corporate components both prior to and
since the Great Recession.
Let's start with this
graphic that shows the total world debt, excluding that of the financial
sector, as a percentage of global GDP:
Other than a slight
slowdown in growth between 2008 and 2009, the growth of debt continues
unabated.
Here is a breakdown of
the types of global debt in billions of U.S. dollars for developed economies by year:
Here is a breakdown of
the types of global debt in billions of U.S. dollars for emerging economies by year:
Prior to 2008, developed
economies led the growth in global debt accumulation. This changed after
2008 with emerging economies, especially China, leading the debt accumulation
"parade". From 2001 to 2013, this is what growth in debt-to-GDP ratios, excluding the financial sector, looked like for the world as well as both developed and
emerging economies:
The preceding graphics
show us that global debt deleveraging has not taken place since the Great Recession; the global
debt-to-GDP ratio has not improved, rather it has risen from 174 percent of GDP
in 2008 to 212 percent of GDP in 2013, an increase of 38 percentage points or
21.8 percent. Leverage in developed markets was 272 percent of GDP and in
emerging markets, was 151 percent of GDP at the end of 2013. If we include
the financial sector in debt for developed economies, the debt-to-GDP level
rises to a whopping 385 percent, a level that has been more-or-less consistent
since 2010.
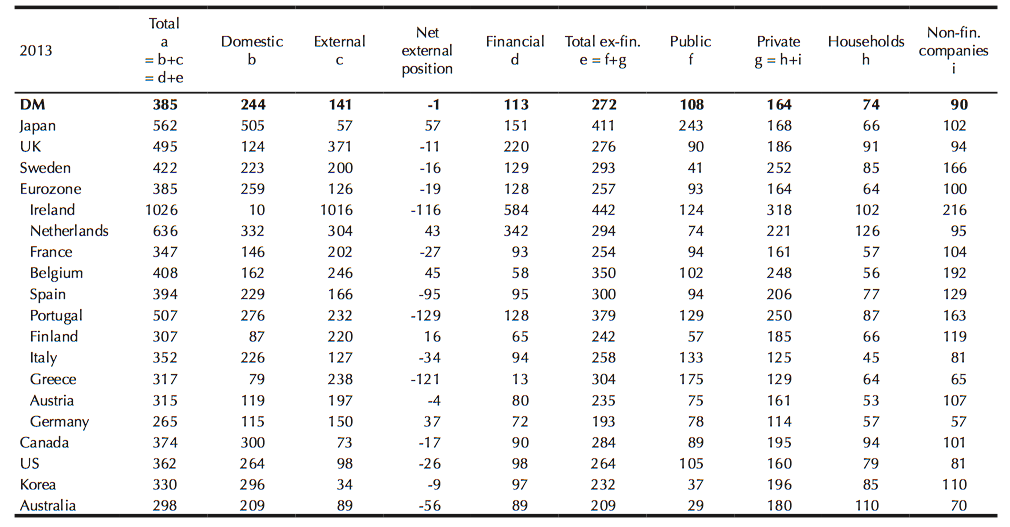
Here is a table showing
global debt as a percentage of GDP excluding financial corporations for the end
of 2013 for developed economies:
Debt levels in Japan are
stunning, reaching 562 percent of GDP including the financial sector and 411
percent of GDP when the financial sector is excluded. Total debt levels
in the United States reached 362 percent of GDP including the financial sector
and 264 percent of GDP when the financial sector is excluded. Total debt
levels in Canada reached 374 percent of GDP including the financial sector and
284 percent of GDP when the financial sector is excluded.
It is interesting to note
which nations have the worst levels of household debt. The Netherlands
comes in first place with 126 percent of GDP, Australia comes in second with
110 percent of GDP, Ireland comes in third with 102 percent of GDP and Canada
comes in fourth with 94 percent of GDP. All four are well above the 74
percent average household debt-to-GDP for developed economies. It is not
surprising that both Australia and Canada (and, at one time, Ireland) have some of the world's most
over-priced and unaffordable residential real estate, forcing consumers to take
on massive debt to purchase even a modest home.
While this table repeats
some of the information on the preceding table, it provides us with debt data
(excluding the financial sector) from emerging economies:
China, the world's
economic driver, has seen its debt level mushroom over the recent years,
growing by 72 percentage points
The capacity of the
economy to absorb ever-growing levels of debt is highly dependent on economic
growth, inflation and real interest rates. As we've seen since the end of
the Great Recession, economic growth has been tepid and some economists feel
that the 2008 crisis has created a permanent decline in both the level and
growth rate of output. Headline inflation has been very low meaning that
governments can't count on inflation to reduce government debt as they
did in the past. Right now, with central banks turning on the credit
taps, households, businesses and governments around the world have been able to
avail themselves of an endless supply of credit at interest rates that are
negligible compared to the past. Current real interest rates are slightly above zero on ten year Treasuries, a situation that is quite likely unsustainable over the long-term.
We have to remember that
we are almost six years into the latest "recovery". History since 1945 shows that recessions occur roughly every six years on average.
From the data in this report, it certainly appears that the hard lessons
regarding excessive debt that led to great hardships during and after the 2008 recession have been long forgotten and that any
perception that the economy is healthier now because it underwent significant deleveraging over the past
six years is merely an illusion.


Well at some point growth must stop. One way or another it will slow down, advanced nations have seemed to slow down population growth which in turn slows down all other growth. Maybe we are getting to that point all over the world slowly but surely.
ReplyDeleteWhere could one source this data? I am interested in modelling rate of change over the last 5 years for Canada.
ReplyDelete