Showing posts with label California. Show all posts

Wednesday, January 15, 2025

California's Wildfire History and Where Governments Went Wrong

With the leftists insisting that California's current wildfire situation is "historical" and is directly tied to "global climate change" and "increased anthropogenic greenhouse gas emissions", research would suggest that California has long been a locus of major wildfires that have scorched millions of acres of land on an annual basis.


A 2007 study entitled "Prehistoric fire area and emissions from California's forests, woodlands, shrublands and grasslands" by Scott L. Stephens et al summarizes the literature on fire history in the state, examining estimates of the spatial extent of the fires and their resultant emissions prior to the European-American settlement of the region.  


The modern state of California has directed its efforts to reducing the negative effects of wildfires in the urban - wildland intermixed zone without giving consideration to wildfire behaviour prior to the expansion of non-Native American settlements.  Prior to the expansion of human population in the state, lightning was the most common ignition source for fires in California's ecosystem.  Once the area was settled by Native Americans, ignition by both lightning and deliberate setting of fires by Native Americans worked together until the arrival of Euro-American settlers in the 19th century.  


To reconstruct fire history for the state, researchers use dendrochronology (analysis of tree rings and tree ages) to determine the fire history.  In scrublands and grasslands, dendrochronology cannot be used because of the absence of trees, necessitating the use of charcoal deposit analysis, however, the ability of these studies makes it difficult to determine the temporal and spatial resolution of wildfires.  Native American burning practices can be used to estimate fire frequency in California because the Native American population used fire management in grasslands and woodlands for various purposes including the maintenance of forest structure, sustainable and revitalized growth and biodiversity.  In other words, Native Americans used fire to help a healthy forest ecosystem flourish.  This practice of intentional burning was outlawed under California's 1850 Act for the Government and Protection of Indians because the practice was seen as "primitive".  In the early 20th century, California adopted a policy of fire exclusion which resulted in undesirable impacts on the ecosystem including increased tree density, higher fuel loads and changes to wildlife habitats in ecosystems that previously experienced more frequent, low to medium intensity fires.  Prescribed fires that are used in California today to manage its forests and shrublands are constrained by several factors including smoke production, the impact on endangered species, lack of crew availability and the fear that prescribed fires may escape their boundaries and enter urban areas.


The authors of the paper estimated prehistoric fire areas by using two methods:


1.) Fire rotation - the time period of interest divided by the proportion of the study area that burned in that time period.


2.) Fire-return interval - the time between two successive fire events at a given site or area of a specified size, more specifically the median fire-return interval and the high fire-return interval.


These fire metrics were divided into the area of each vegetation type to arrive at estimates of the area burned each year excluding California's desire regions because fire was likely rare in these areas which have limited vegetation productivity.


Here are tables showing the annual prehistoric fire estimates for California for various vegetation types:


To summarize, the amount of area burned annually in California varied from 1,814,614 hectares (4,484,008 acres) to 4,838,293 hectares (11,955,682 acres) during the prehistoric period or between 4.5 percent and 12 percent of the state's lands burning every year.


The authors note that in the modern period between 1950 and 1999, wildfires in California have burned approximately 51,000 hectares (126,023 acres) annually and forested areas have burned at approximately 23,000 hectares (56,834 acres) annually.  If one totals the total area burned on an annual basis when grasslands and woodlands are included, approximately 102,000 hectares (252,047 acres) burn in wildfires on an annual basis in California.  This is a very small area (roughly 5.6 percent of what would have been burned in the past) compared to prehistoric levels largely because relatively large areas of grasslands and woodlands have been converted to agricultural and urban use.


This study clearly shows that, in general, the area burned by wildfires in the state of California is far smaller in the modern age than in prehistoric, pre-Euro-American times when fires were often deliberately set by Native Americans to improve the health of the state's ecosystem.  The lack of fires and the changes in the amount of forest cover in the modern age as shown on this graphic:


...shows us that it is the buildup of fuel that has resulted in wildfires impacting urban areas that continue to spread into grassland and forested ecosystems that are prone to burning.  In large part, this can be blamed on state and federal regulations that resulted in closely packed forests that are prone to parasitic attacks and crown fires after logging and a lack of controlled burning because of concerns about air quality in urban areas.  While our government leaders love to fear monger and blame any wildfires on global climate change, in fact, history shows us that wildfires of far greater areal extent than we are experiencing today were quite common and, in the absence of human habitation, were actually very healthy and necessary for the environment.


Sunday, February 2, 2014

Dry and Thirsty in California

According to the USDA Drought Monitor, the southwestern United States, particularly California, is suffering from a prolonged and rather exceptional drought.  Here is a map showing drought conditions across the United States with darker areas showing drought intensity:


Here is a closeup of California:


In total, 98.57 percent of the state is suffering from abnormally dry conditions or worse, up from 65.8 percent last year at the same time.  A shocking 67.1 percent of the state is suffering from an extreme or exceptional drought, up from zero percent last year at the same time, however, approximately 22 percent of the state was suffering from a severe drought in January 2013. 

Let's look at three details:

1.) The Central Sierra Snow Lab, located in the Sierra Nevada near Donner Pass reports only 8 inches of snow on the ground, the lowest snowpack for this point in January since 1946.

2.) In the D4 (exceptional drought) drought area between Monterey and Bakersfield, wells have run dry with municipalities having to drill deeper wells.  As well, rangelands have no grass cover, prompting farmers to sell off livestock.

3.) The State Water Project, part of the California Department of Water Resources which supplies water for 25 million Californians and 750,000 acres of irrigated farmland, announced that it has taken action to conserve the state's water resources, cutting allocations to farmers and people in the state's cities and towns.  Storage in the state's key reservoirs is lower than at this time in 1977, one of the two previous driest years on record.  Lake Oroville in Butte County is at 36 percent of its capacity (compared to an average of 55 percent) and San Luis Reservoir is at a mere 30 percent of its capacity (compared to an average of 39 percent).  Never before has the State Water Project announced a zero allocation to all 29 public water agencies that buy water from it. 

Here is a map showing the response of vegetation to the drought:


A total of 26.6 percent of the state shows moderate to extreme vegetation stress related to the current drought conditions as measured by the VegDRI or Vegetation Drought Response Index which is based on remote sensing, climate and biophysical data.  Last year at this time, only 14 percent of the state showed similar conditions.

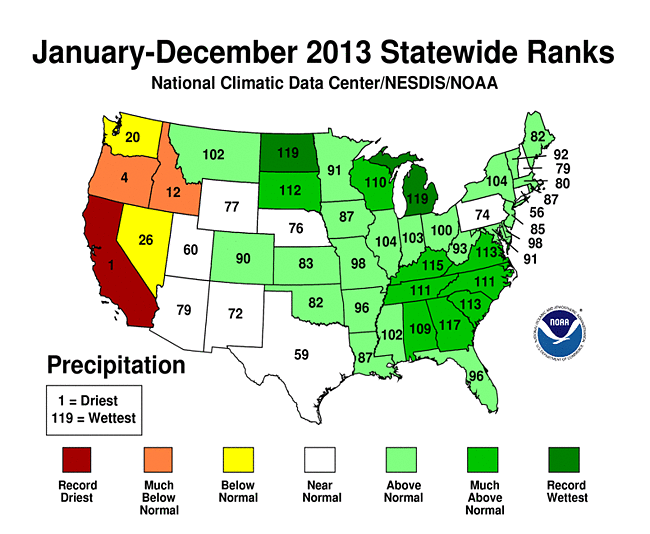
Data from the National Oceanic and Atmospheric Administration (NOAA) shows us how this problem for California came about.  Here is a map showing the states ranked by the amount of precipitation they received during 2013:


California was the driest state overall and had the driest year on record, receiving only 7.38 inches of precipitation, 15.13 inches below average and 2.42 inches below the previous record dry year of 1898.  

Here is a map showing the states ranked by their average temperature during 2013:


California was the only state that had temperatures that were much above normal during 2013 and it was the warmest state in the continental United States.  California tied its twelfth warmest year with a statewide temperature that was 1.4 degrees Fahrenheit above average. 

Let's close by looking at the definition of climate:

"Climate is the average course or condition of the weather at a place usually over a period of years as exhibited by temperature, wind velocity, and precipitation."


Certainly, California's warm and extremely dry weather cannot be attributed to climate change since weather is a short-term phenomenon, however, since climate is defined by the average condition of the weather over a period of time, eventually all of the current data will become part of the climate record.  When enough of these anomalous conditions add up and become part of the average, eventually, it will become apparent whether climate is changing or we're just having a few years of anomalous weather.  Unfortunately, by then, it will be long past too late to do anything about it.  With California producing nearly half of the fruits, vegetables and nuts grown in the United States, the current drought is going to have a wide impact in any case.

Monday, March 14, 2011

Earthquakes - Living on the Fault Line and Waiting for the "Big One" in California


In light of last week’s massive 9.0 magnitude earthquake off the northeast coast of the island of Honshu in Japan, I thought it was time to examine the literature from various sources that discuss the probability of an earthquake on the eastern side of the Ring of Fire, more specifically, the west coast of the United States that is adjacent to the well-known San Andreas Fault.  Here is a map showing the San Andreas Fault:


The San Andreas Fault behaves differently than the fault that caused the earthquake in Japan on March 11, 2011.  The San Andreas Fault is termed a right lateral strike-slip fault by geologists.  In these faults, the fault surface itself dips very steeply into the earth’s surface.  There is very little vertical (up and down) motion along these faults, rather, the motion is offsetting from one side of the fault to the other.  In this case, if a line were painted on the surface of the ground across the fault, after an earthquake, the line would be offset where it crossed the fault line.  In the case of Japan’s most recent massive earthquake, the fault surface dipped relatively steeply (but not vertically) into the ground at the margins of a crustal plate boundary as one plate was riding under the other.  In the case of California, the San Andreas fault is found at the boundary between the Pacific Plate and the North American Plate but, because the motion is strike-slip, the land on the Pacific Plate (west side of the fault) is moving slowly to the northwest and the land on the North American Plate (east side of the fault) is moving to slowly to the southwest.  The amount of motion on the fault is roughly 1.3 to 1.5 inches per year.  In other words, the east side of California is headed south and the west side is headed north.

Here is a block diagram showing the mechanics behind the movement of the earth's crust along the San Andreas Fault:

Here is a photograph of the fault:


Earthquakes occur along strike-slip faults when the forces that are pushing the sides of the fault in the opposite direction overcome the friction along the surface of the fault plane.  The sudden release of energy when the two sides "unlock" is what we feel as ground shaking. 

Despite advances in the tools available to them, geoscientists find it very difficult to predict when an earthquake will take place and what its magnitude will be when it does occur.  Part of the problem is that most of the very large earthquakes in the world, especially those in California, took place well before the advent of seismometers that are used to measure the magnitude of ground motion.

Using advanced (and advancing) technology, geoscientists have recently discovered that geological records indicate that very large earthquakes took place along the San Andreas Fault in 1417, 1462, 1565, 1614 and 1713, roughly every 50 to 100 years and averaging every 88 years (plus or minus 44 years).  This was far more frequent than earlier interpretations that had stated that major earthquakes occurred every 250 to 450 years.  The last major earthquake along the fault, a magnitude 7.9 quake, took place in 1857, nearly 155 years ago.  By extrapolation from historical records, with earthquakes having taken place every 50 to 100 years for the past 600 years, it appears that the San Andreas Fault is well overdue for a major release of stored energy.

An important issue that faces the inhabitants of southern California is the composition of the sediment underlying major cities like Los Angeles and San Bernadino.  The material is relatively soft and unconsolidated because it has been eroded from nearby mountains and accumulated in basins covering large areas overlying the San Andreas and its related faults.  This material is structurally unstable and when long amplitude earthquake waves are injected into the material, it loses its stability and liquefies and acts in a similar fashion to jelly.  This liquifaction was seen in the February 2011 earthquake that impacted Christchurch, New Zealand where large areas of the city were flooded by a mud and water mixture as the fluids trapped within the sediment caused it to become unstable when it was shaken.

Several scientific organizations in California study and track the occurrence of earthquakes in an attempt to gain a better understanding of both timing and magnitude.  The Southern California Earthquake Data Centre tracks earthquakes in, of all places, California (and Nevada).  From their website, here is a map showing earthquakes over the past week, day and hour.  Note that the small brown lines on the map are faults.  Most of the recent earthquakes are quite small with the largest earthquake over the past week having a magnitude of 3.4:


Here’s a map showing some of the most significant and damaging earthquakes in Southern California since 1812:


There have been several massive earthquakes but only one with a magnitude of 8.0 or greater.  This earthquake with an approximate epicenter northeast of San Luis Obispo, is last major earthquake on the San Andreas Fault as mentioned above.  It took place on January 9, 1857  and had an estimated magnitude of 7.9.  The surface of the earth ruptured for over 350 kilometres, yet only two people were killed because the area was very sparsely populated at the time.  The fault’s average slip was 4.5 metres or 15 feet and its maximum slip was about 9 metres or 30 feet (meaning that one side of the fault moved laterally up to 30 feet with respect to the other side).  Here is a map showing the area of the fault that moved in red and the approximate epicenter:


Geoscientists feel that the area where the 1857 earthquake took place is the most likely location for the next major earthquake, particularly because it has been locked in place for far longer than normal.  Unfortunately, the area is far more densely populated now than it was in 1857.  Geoscientists are constantly monitoring the seismic activity along the San Andreas Fault in an attempt to approximate when a major earthquake will hit.  Before the next earthquake, geoscientists expect that there will be an increase in small earthquakes,.  As well, there should be a change in the measured distance and elevation profiles of survey lines that cross the fault. 

While science cannot predict the timing or magnitude of the next major earthquake along the San Andreas Fault, geoscientists can say with confidence that the next major event will happen sooner rather than later. The Uniform California Earthquake Rupture Forecast (UNCERF) report released by the 2007 Working Group on California Earthquake Probabilities (WGCEP – don’t you love those acronymns?) used improvements in earth sciences to predict that California has a 99.7 percent chance of having a magnitude 6.7 or greater earthquake in the next 30 years and a 46 percent chance of having a magnitude 7.5 or greater earthquake in the next 30 years.  Here is a map showing the probability of various magnitude earthquakes over the next 30 years for the entire State of California:


Over the next 30 years, there is a 59 percent chance (the highest risk fault in the state) that there will be an earthquake with a magnitude of greater than 6.7 along the San Andreas Fault as shown here:


One of UNCERF’s particularly unsettling predictions is their prediction for the Cascadia Subduction Zone that runs in a north – south direction through the northern part of California and the states of Oregon and Washington and north into British Columbia, Canada.  Here is a map showing the location of the Cascadia Subduction Zone:


An earthquake of this type would be formed in a very similar manner to the March 11th, 2011 earthquake in Japan.  UNCERF predicts that there is a 10 percent chance of a magnitude 8 to 9 earthquake over the next 30 years along the Cascadia Subduction Zone, a very similar magnitude when compared to the earthquake just experienced in Japan.

In closing, the population of Seattle, Washington was 608,660 in 2010 and the greater Seattle – Tacoma – Bellevue metropolitan region has a population of  3.34 million,  Portland, Oregon has a population of 545,140 and the population of San Luis Obispo Country was estimated  to be 267,000 in 2009.  Let’s hope that the UNCERF study is wrong….but I don’t think that’s likely.