Showing posts with label earthquake. Show all posts

Monday, February 6, 2023

Explaining Turkey's February 2023 Earthquake

As you will see in this posting, the geology behind the recent earthquake in Turkey and Syria is rather complex although not surprising given that the area is prone to tectonic activity given its location where tectonic plates collide.


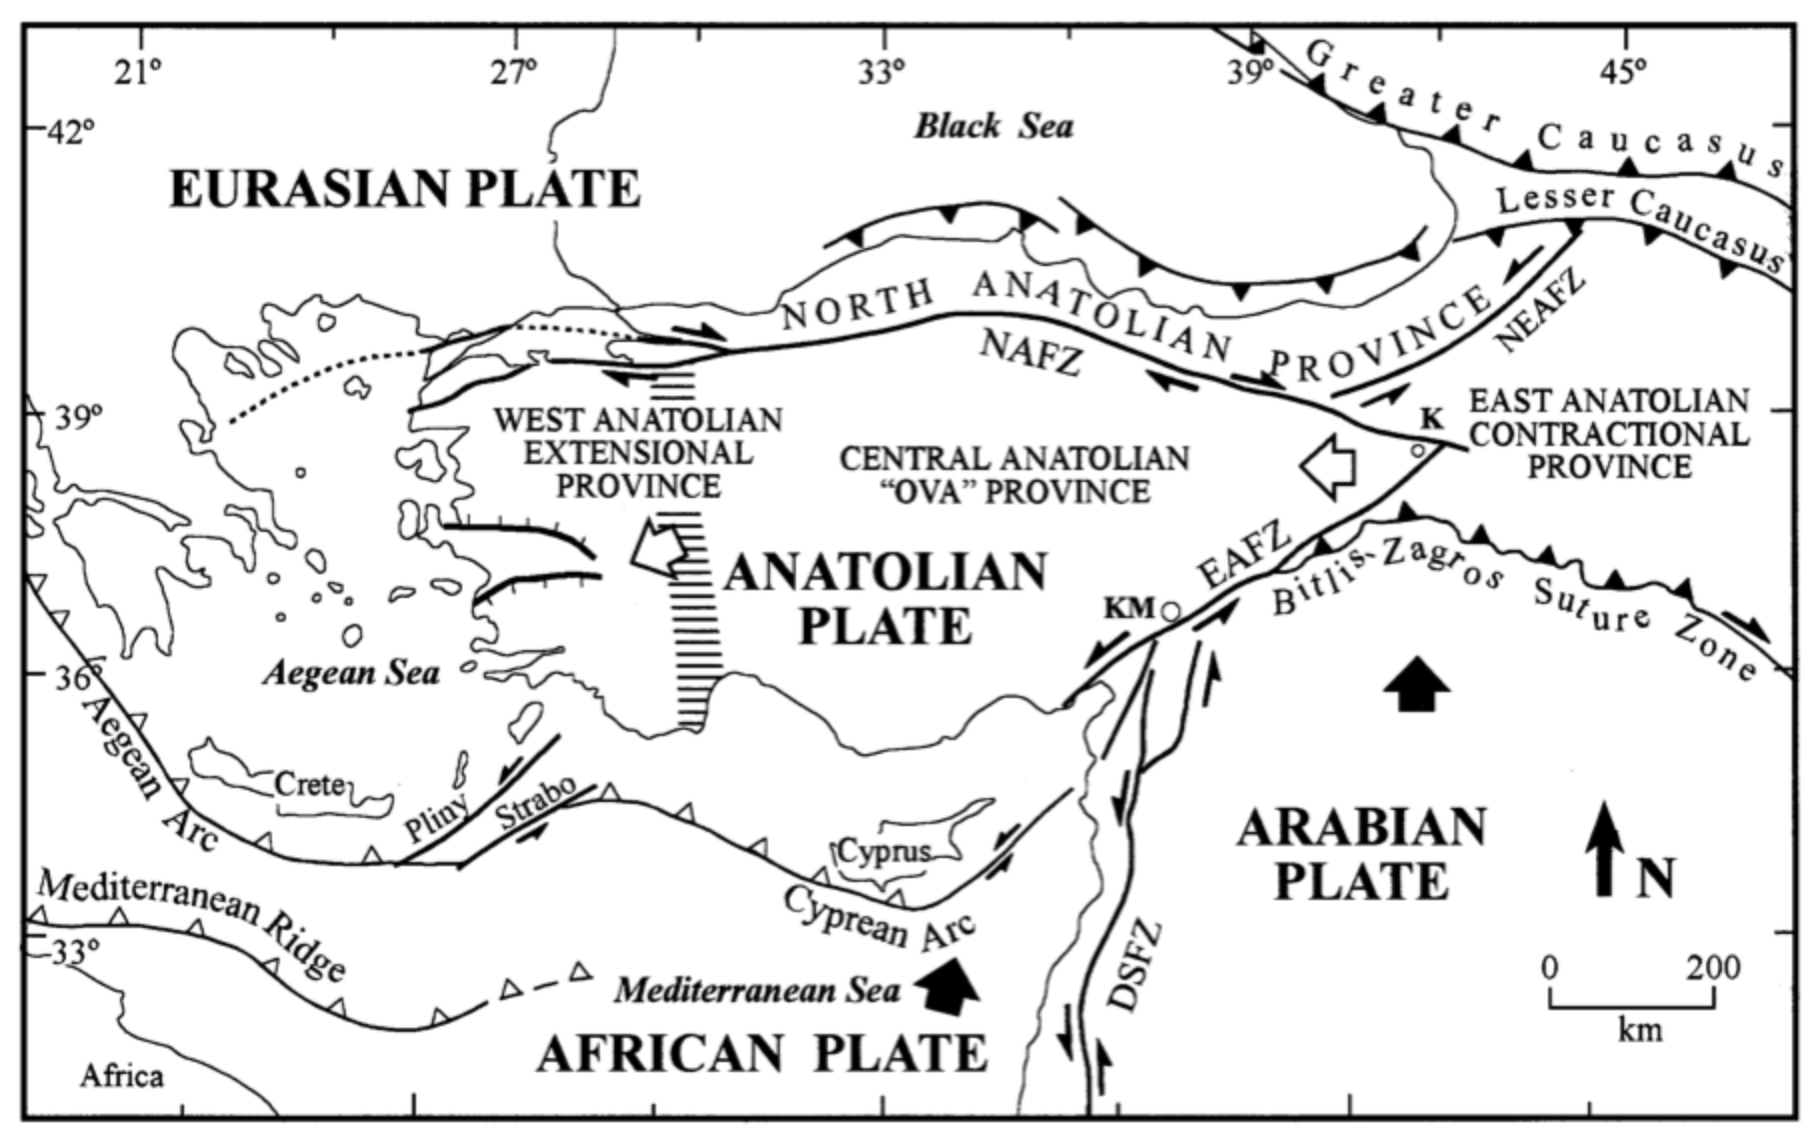
Here are two maps showing the basic geological setting of Turkey:


Here is a map which provides more detailed geological information:


Notice the two major faults labelled NAFZ and EAFZ which are located inside the borders of Turkey; the North Anatolian Fault Zone and the East Anatolian Fault Zone.  These two faults are strike-slip or transform faults which connect tectonic plates that are moving in opposite directions; in this case, the Arabian Plate, the Anatolian Plate and the Eurasian Plate.  Movement along the faults is horizontal as shown on this very basic block diagram:


As the plates try to slide past each other, energy builds up as a result of the horizontal shearing motion which is locked as a result of the friction between the plates.  This friction suddenly suddenly releases and results in an earthquake.  Earthquakes associated with transform faults are often shallow and have large lateral displacement.


This is the same scenario as the San Andreas Fault in California, in fact, the two faults which are located along a continental margin (Pacific Ocean and Black Sea) are very similar in length as shown on this diagram:
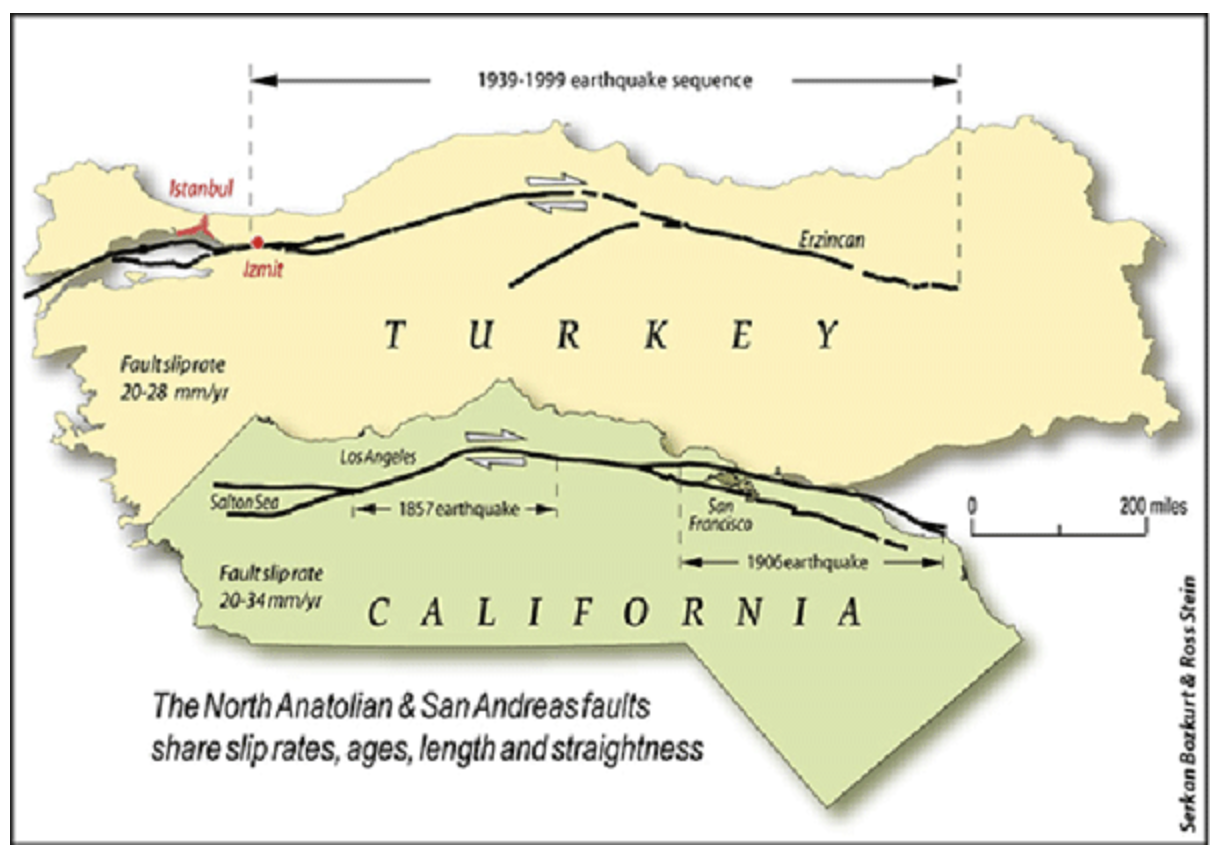


In August 1999, movement along the North Anatolian fault (a right-lateral transform/strike-slip fault) resulted in the 7.4 magnitude Izmir earthquake and the deaths of 17,000 people and destroyed the homes of more than 250,000 people. The main earthquake was followed by a magnitude 7.2 earthquake in November 1999 which resulted in an additional 845 deaths.


The 2023 earthquake series is located along the East Anatolian Fault (a left-lateral transform/strike-slip fault).  Here is a more detailed map of the East Anatolian Fault Zone (EAFZ) which runs roughly northeast-southwest through the map area:


The East Anatolian Fault forms the boundary between the Anatolian Plate (located under most of Turkey) and the Arabian Plate.  As the Arabian Plate moves northward, it is squeezing out the Anatolian Plate which is colliding with the Eurasian Plate to the north as shown on these two diagrams:


The East Anatolian Fault Zone has a long history of earthquake activity as shown on this map from a study which analyzed the earthquake hazard for the fault zone:


This 2015 analysis calculated that there was a 90 percent probability of an earthquake with a magnitude of more than 6.0 in the next 43 years.


Let's close this posting with this map from the United States Geological Survey showing the earthquake activity (magnitude greater than 2.5) over the past day:


So far, there have been 76 earthquakes in the immediate area with the four largest as follows:


The largest earthquake, a 7.8 magnitude temblor, struck near Gaziantep at a depth of 18 kilometres followed 15 minutes later by a 6.7 magnitude quake near the site of the first event. There have been an additional 13 earthquakes/aftershocks with a magnitude of 5.0 or greater. 


I hope that this information helps you to better understand the geology behind the February 2023 earthquake in Eastern Turkey.


Monday, October 26, 2015

Living on the Fault Line In America

Updated October 2018

In a recent iteration of its United States National Seismic Hazard Maps, the United States Geological Survey (USGS) has updated the predictions of geoscientists regarding the areas of the U.S. that are most prone to earthquakes, how frequent the earthquakes will be and the magnitude of the earthquakes.

According to the USGS, of the 50 states, 42 have a reasonable chance of experiencing a damaging earthquake over a fifty year period and 16 of those states have a relatively high chance of experiencing earthquake-related damage as you can see on this map:


Not surprisingly, the risk is particularly high along the west coast of the United States and in the western intermountain area; this would include the states of Alaska, California, Hawaii, Nevada, Montana, Washington, Oregon and Wyoming.  

While most of us tend to think of the aforementioned states when we think of earthquakes in the U.S., in fact, when you look at the map, you will notice the dark coloured area in the south central part of the United States.  This area, encompassing parts of Missouri, Arkansas, Tennessee, Kentucky and Illinois as well as peripheral states including Illinois and Mississippi, are adjacent to the New Madrid Seismic Zone or NMSZ.   Here is a map from the USGS showing the faults of the New Madrid Seismic Zone:


Here is a map showing the history of earthquake epicentres along the New Madrid Seismic Zone with the circles being scaled according to the magnitude of the earthquake and coloured according to time (red indicating earthquakes that occurred from 1974 to 2002 with magnitudes greater than 2.5 and green circles indicating earthquakes that occurred prior to 1974):


Here is an even more detailed map showing the epicentres of the major earthquakes as well as the smaller earthquakes along the offset fault lines from a 2008 study by the Missouri Department of Insurance:


Unlike the faults in the Pacific region of the United States that are often seen at or very close to the surface, the faults of the NMSZ are poorly understood because they are buried by between 100 and 250 feet of soil deposited by rivers and an additional 2500 feet of older sedimentary rocks.  Scientific knowledge about the NMSZ faults are gained from studying the seismographic records obtained through the use of more than 30 seismographs throughout the area.  

Here is a block diagram showing the geology of the fault:


The fault itself is about 125 miles long and has four main offset segments. The present day faults consist of reactivated faults that began as a continental rift zone roughly 750 million years ago.  If you don't understand the concept of a rift zone, think of a tear in the earth's crust similar to what we see today in the Red Sea and through the Rift Valley of eastern Africa.  As the earth's crust spreads, igneous rocks from the mantle rise into the crust; in the New Madrid Seismic Zone this occurred about 200 million years ago.  Today, the motion along the fault is both thrusting due to lateral compression and strike-slip where one part of the earth slides laterally past another, similar to the San Andreas fault.

Geoscientists have observed that there are roughly 200 microseismic (magnitude 1.0 to 2.0) earthquakes every year along the NMSZ.  Between 1974 and 2008, there were an estimated 4000 earthquakes   Every so often, there are very significant earthquakes along the NMSZ; one of the largest earthquakes to strike the continental United States occurred during the winter of 1811 - 1812 along the New Madrid Seismic Zone.   While there were no seismographs that recorded the events of December 16, 1811, January 23, 1812 and February 7, 1812, looking at the historical records of the damage done by the trio of earthquakes (note, that the second and third earthquakes are not believed to be aftershocks) has led geoscientists to believe that the earthquakes each had a magnitude of between 6.8 and 8.0 depending on the study as shown on this chart:


On top of that, studies have estimated that an additional 200 moderate to large earthquakes shook the region between December 16, 1811 and March 15, 1812.  For your illumination, San Francisco's 1906 earthquake had a magnitude of 7.8.

One of the problems facing residents of the area is the type of sediment that is deposited at the surface, overlying the fault zones.  These river sediments, also known as alluvium, can liquify when shaken, resulting in structural instability which negatively impacts the foundations of buildings and other infrastructure.  This occurs when an earthquake has a magnitude of 6.0 or greater.

The USGS predicts that the likelihood of a 7.7 magnitude earthquake hitting the region over the next fifty years at less than 7 to 10 percent (compared to an estimate of 20 to 40 percent by the Central United States Earthquake Consortium), however, loss calculations from an earthquake with a magnitude of this size for Missouri alone would look like this:


Given that the New Madrid earthquake of 1811 shook the ground in Boston, Massachusetts, 1000 miles away, causing church bells to ring, the damage zone from a high magnitude earthquake along the NMSZ could cover a large geographic area.  With that in mind, the Mid-American Earthquake Centre projects that total economic losses for the states along the NMSZ would look like this:


Since the areas impacted include the cities of St. Louis, Missouri and Memphis, Tennessee with a combined population of nearly 1 million people and that most of the buildings in the region were not built to the same earthquake-proof standards as those on much of the Pacific coast, the damage to both the economy and to the human population caused by a significant earthquake along the New Madrid Seismic Zone could prove to be catastrophic.

Wednesday, September 5, 2012

Costa Rica - A Seismically Active Nation


Today's earthquake in Costa Rica, while quite large at a 7.9 magnitude, is not unprecedented and not unexpected by the world's geoscience community.  Here is some background information on Costa Rica's geology, something that I have seen firsthand.

Costa Rica sits along the boundary of the Cocos and Caribbean Plates as shown on this map:


The Cocos Plate is being subducted under the Caribbean Plate along the Mesoamerican trench and it is this subduction, similar to what exists in Japan, that it responsible for the country's seismic and volcanic activity.  The Cocos and Caribbean Plates converge at a rate of about 75 millimetres per year and the Cocos slab dips under the Carribbean plate at a 45 degree angle.  As the oceanic crust of the Cocos Plate descends into the depths of the crust, temperatures rise and the oceanic crust melts and rises back through the continental crust of Costa Rica, forming a chain of volcanoes including Arenal, the most active of Costa Rica's seven historically active volcanos as shown on this diagram:


When I visited Arenal, a picture-perfect conical volcano, I could see and hear huge boulders frequently erupting from from the volcano and noticed many steam vents along its flank, indicating it was still quite active.  Vulcanologists believe that Arenal is tapping a lower to mid-crustal magma chamber located about 22 kilometres below the surface.  In July 1968, Arenal erupted explosively, killing 78 people and devastating 12 square kilometres.

Subduction has created two staggered mountain ranges, the northernmost is a chain of young, active volcanoes and the southern range is the uplifted and eroded core of an earlier volcanic chain as shown on this relief map:  


The relief of some of these mountains is amazing; Cerro Chirripo has a peak altitude of 12,300 feet and was high enough to support glaciers during the Pleistocene.  Despite the fact that they are located in tropical climates, the summits of both Irazu and Turrailba can experience snow, both peaking at around 11,000 feet.

Costa Rica has a relatively long history of fairly large earthquakes.  The April 1991 magnitude 7.6 earthquake killed 47 people in the Limon area on the Caribbean coast and left 7439 homeless.  This earthquake was accompanied by a 2 metre tsunami which ran up as far as 300 metres.  In January 2009, a magnitude 6.1 earthquake centred 30 miles northwest of San Jose killed at least 20 people in landslides.  This particular quake was a strike-slip event related to subduction of the Cocos Plate.

Subduction of the Cocos plate has been responsible for some very damaging earthquakes.  The most memorable in our lifetime was the 1976 Motagua magnitue 7.5 earthquake in Guatemala that killed 23,000 and injured 76,000.  In January 2001, a magnitude 7.7 earthquake in El Salvador killed 852 people and damaged 150,000 buildings.

Here's hoping that Costa Ricans suffer little disruption from today's geologically significant earthquake.

Monday, March 14, 2011

Earthquakes - Living on the Fault Line and Waiting for the "Big One" in California


In light of last week’s massive 9.0 magnitude earthquake off the northeast coast of the island of Honshu in Japan, I thought it was time to examine the literature from various sources that discuss the probability of an earthquake on the eastern side of the Ring of Fire, more specifically, the west coast of the United States that is adjacent to the well-known San Andreas Fault.  Here is a map showing the San Andreas Fault:


The San Andreas Fault behaves differently than the fault that caused the earthquake in Japan on March 11, 2011.  The San Andreas Fault is termed a right lateral strike-slip fault by geologists.  In these faults, the fault surface itself dips very steeply into the earth’s surface.  There is very little vertical (up and down) motion along these faults, rather, the motion is offsetting from one side of the fault to the other.  In this case, if a line were painted on the surface of the ground across the fault, after an earthquake, the line would be offset where it crossed the fault line.  In the case of Japan’s most recent massive earthquake, the fault surface dipped relatively steeply (but not vertically) into the ground at the margins of a crustal plate boundary as one plate was riding under the other.  In the case of California, the San Andreas fault is found at the boundary between the Pacific Plate and the North American Plate but, because the motion is strike-slip, the land on the Pacific Plate (west side of the fault) is moving slowly to the northwest and the land on the North American Plate (east side of the fault) is moving to slowly to the southwest.  The amount of motion on the fault is roughly 1.3 to 1.5 inches per year.  In other words, the east side of California is headed south and the west side is headed north.

Here is a block diagram showing the mechanics behind the movement of the earth's crust along the San Andreas Fault:

Here is a photograph of the fault:


Earthquakes occur along strike-slip faults when the forces that are pushing the sides of the fault in the opposite direction overcome the friction along the surface of the fault plane.  The sudden release of energy when the two sides "unlock" is what we feel as ground shaking. 

Despite advances in the tools available to them, geoscientists find it very difficult to predict when an earthquake will take place and what its magnitude will be when it does occur.  Part of the problem is that most of the very large earthquakes in the world, especially those in California, took place well before the advent of seismometers that are used to measure the magnitude of ground motion.

Using advanced (and advancing) technology, geoscientists have recently discovered that geological records indicate that very large earthquakes took place along the San Andreas Fault in 1417, 1462, 1565, 1614 and 1713, roughly every 50 to 100 years and averaging every 88 years (plus or minus 44 years).  This was far more frequent than earlier interpretations that had stated that major earthquakes occurred every 250 to 450 years.  The last major earthquake along the fault, a magnitude 7.9 quake, took place in 1857, nearly 155 years ago.  By extrapolation from historical records, with earthquakes having taken place every 50 to 100 years for the past 600 years, it appears that the San Andreas Fault is well overdue for a major release of stored energy.

An important issue that faces the inhabitants of southern California is the composition of the sediment underlying major cities like Los Angeles and San Bernadino.  The material is relatively soft and unconsolidated because it has been eroded from nearby mountains and accumulated in basins covering large areas overlying the San Andreas and its related faults.  This material is structurally unstable and when long amplitude earthquake waves are injected into the material, it loses its stability and liquefies and acts in a similar fashion to jelly.  This liquifaction was seen in the February 2011 earthquake that impacted Christchurch, New Zealand where large areas of the city were flooded by a mud and water mixture as the fluids trapped within the sediment caused it to become unstable when it was shaken.

Several scientific organizations in California study and track the occurrence of earthquakes in an attempt to gain a better understanding of both timing and magnitude.  The Southern California Earthquake Data Centre tracks earthquakes in, of all places, California (and Nevada).  From their website, here is a map showing earthquakes over the past week, day and hour.  Note that the small brown lines on the map are faults.  Most of the recent earthquakes are quite small with the largest earthquake over the past week having a magnitude of 3.4:


Here’s a map showing some of the most significant and damaging earthquakes in Southern California since 1812:


There have been several massive earthquakes but only one with a magnitude of 8.0 or greater.  This earthquake with an approximate epicenter northeast of San Luis Obispo, is last major earthquake on the San Andreas Fault as mentioned above.  It took place on January 9, 1857  and had an estimated magnitude of 7.9.  The surface of the earth ruptured for over 350 kilometres, yet only two people were killed because the area was very sparsely populated at the time.  The fault’s average slip was 4.5 metres or 15 feet and its maximum slip was about 9 metres or 30 feet (meaning that one side of the fault moved laterally up to 30 feet with respect to the other side).  Here is a map showing the area of the fault that moved in red and the approximate epicenter:


Geoscientists feel that the area where the 1857 earthquake took place is the most likely location for the next major earthquake, particularly because it has been locked in place for far longer than normal.  Unfortunately, the area is far more densely populated now than it was in 1857.  Geoscientists are constantly monitoring the seismic activity along the San Andreas Fault in an attempt to approximate when a major earthquake will hit.  Before the next earthquake, geoscientists expect that there will be an increase in small earthquakes,.  As well, there should be a change in the measured distance and elevation profiles of survey lines that cross the fault. 

While science cannot predict the timing or magnitude of the next major earthquake along the San Andreas Fault, geoscientists can say with confidence that the next major event will happen sooner rather than later. The Uniform California Earthquake Rupture Forecast (UNCERF) report released by the 2007 Working Group on California Earthquake Probabilities (WGCEP – don’t you love those acronymns?) used improvements in earth sciences to predict that California has a 99.7 percent chance of having a magnitude 6.7 or greater earthquake in the next 30 years and a 46 percent chance of having a magnitude 7.5 or greater earthquake in the next 30 years.  Here is a map showing the probability of various magnitude earthquakes over the next 30 years for the entire State of California:


Over the next 30 years, there is a 59 percent chance (the highest risk fault in the state) that there will be an earthquake with a magnitude of greater than 6.7 along the San Andreas Fault as shown here:


One of UNCERF’s particularly unsettling predictions is their prediction for the Cascadia Subduction Zone that runs in a north – south direction through the northern part of California and the states of Oregon and Washington and north into British Columbia, Canada.  Here is a map showing the location of the Cascadia Subduction Zone:


An earthquake of this type would be formed in a very similar manner to the March 11th, 2011 earthquake in Japan.  UNCERF predicts that there is a 10 percent chance of a magnitude 8 to 9 earthquake over the next 30 years along the Cascadia Subduction Zone, a very similar magnitude when compared to the earthquake just experienced in Japan.

In closing, the population of Seattle, Washington was 608,660 in 2010 and the greater Seattle – Tacoma – Bellevue metropolitan region has a population of  3.34 million,  Portland, Oregon has a population of 545,140 and the population of San Luis Obispo Country was estimated  to be 267,000 in 2009.  Let’s hope that the UNCERF study is wrong….but I don’t think that’s likely.