Mark Carney is selling himself as the consummate economist who will be able to steer Canada through whatever issues the nation will fact as it deals with the Trump 2.0 Administration. In this posting, we'll take a very brief look at just how accurate his predictions were about central bank intervention during the COVID-19 pandemic.
On March 18, 2021, this article appeared in Canada's Globe and Mail:
When he was asked the following question:
"In the book (Value(s): Building a Better World for All), you talk about being worried about the amount of public debt and purchases by central banks. What concerns you the most?
Here is his response:
"I definitely agree with the stance that the major central banks have taken in terms of support. The pandemic is a huge disinflationary, if not deflationary shock, and so the right monetary policy response was in the direction they’ve taken. As well, I’d agree, given that they have fewer and fewer options to provide stimulus when needed, that the shift in the Fed’s reaction function toward this flexible average inflation targeting—so they’d have a bit of an overshoot coming out of this—is also something that’s supported for a durable recovery. We’re gonna get a quick bounce back as things reopen. The question is, does it extend? And I think the Fed’s policy will help it extend."
Not surprisingly, Carney agreed with the stance that his fellow central bankers, particularly at the Federal Reserve, took to prevent disinflation/deflation during the pandemic, admitting that they would have to overshoot their inflation target of 2 percent to support a durable post-pandemic recovery.
Here's what the Federal Reserve did to stimulate the COVID economy:
During most of 2019, the Fed's balance sheet hovered around the $4 trillion mark. On February 26, 2020, the balance sheet stood at $4.159 trillion, rising to $7.17 trillion in June 2020, an increase of $3.011 trillion or 72.4 percent. BY the time that Mark Carney made his comments as noted above, the Fed's balance sheet had risen to $7.904 trillion, an increase of $3.745 trillion or 90 percent above its pre-pandemic level. The balance sheet continued to rise, hitting a peak of $8.965 trillion in April 2022, a total increase of $4.806 trillion or 115.6 percent from its pre-pandemic level. Since then, the Fed's balance sheet has begun a very slow decline to just below $7 trillion.
So, what was the result of all of this money printing? The M2 measure of the supply of money did this:
As a result of the unprecedented increase in the supply of money (after all, all of that "helicoptered money" has to go somewhere), this happened:
The average consumer price index for all goods for all consumers rose by a maximum of 9 percent in June 2022, the highest level of inflation going back to December 1981. According to Shadowstats, the situation was far worse with consumer inflation hitting nearly 13 percent using the pre-1990 definition of inflation and nearly 17.5 percent (which is actually worse than the rate of inflation back in the early 1980s) using the pre-1980 definition of inflation as shown here:
Please keep in mind that while politicians would have us believe that inflation is under control because the rate of inflation has dropped to something approximating the Fed's 2 percent target, the prices of goods and services have NOT dropped, they are just inflating at a lower rate.
Let's repeat what Carney said for emphasis:
"I definitely agree with the stance that the major central banks have taken in terms of support. The pandemic is a huge disinflationary, if not deflationary shock, and so the right monetary policy response was in the direction they’ve taken. As well, I’d agree, given that they have fewer and fewer options to provide stimulus when needed, that the shift in the Fed’s reaction function toward this flexible average inflation targeting—so they’d have a bit of an overshoot coming out of this—is also something that’s supported for a durable recovery."
Is this the kind of economist that Canada needs in a leadership position? For someone who thinks that his level of intelligence far exceeds that of the sweaty peasants and with his experience as a leading central banker, he didn't even have the ability to see that the Fed's actions (as well as the actions of other central banks) during the early stages of the pandemic were going to lead to very painful levels of inflation for consumers, many of whom will not recover financially from this economic shock treatment. He couldn't even seem to grasp the concept that printing unprecedented amounts of "money" would result in a punitive inflationary nightmare.
But then again, does Carney really care what is best for Canadians or is he in it to remold Canada into a World Economic Forum approved dystopia?
"Before May 2020, M2 consists of M1 plus (1) savings deposits (including money market deposit accounts); (2) small-denomination time deposits (time deposits in amounts of less than $100,000) less individual retirement account (IRA) and Keogh balances at depository institutions; and (3) balances in retail money market funds (MMFs) less IRA and Keogh balances at MMFs.
Beginning May 2020, M2 consists of M1 plus (1) small-denomination time deposits (time deposits in amounts of less than $100,000) less IRA and Keogh balances at depository institutions; and (2) balances in retail MMFs less IRA and Keogh balances at MMFs. Seasonally adjusted M2 is constructed by summing savings deposits (before May 2020), small-denomination time deposits, and retail MMFs, each seasonally adjusted separately, and adding this result to seasonally adjusted M1."
As you can see, in all cases particularly since the 2020 pandemic-related recession, the Federal Reserve has been very busy running its "printing presses" at full speed which has resulted in this:
...which has led to a massive devaluation in the value of a dollar. In fact, it would take $29.80 today to purchase what $1 would have purchased in 1913 when the Federal Reserve Act was enacted. A great deal of the devaluation of the dollar can be laid at the feet of President Richard Nixon who ended the convertibility of the United States dollar to gold in 1971 under his New Economic Policy aka the "Nixon Shock" which marked the end of the Bretton Woods system of fixed exchange rates which was adopted near the end of the Second World War to stabilize the world's post-war economy.
Alex Mooney (R-WV) recently introduced House Resolution H.R.9157 entitled the "Gold Standard Restoration Act" which would, for the first time in over 50 years, repeg the dollar to gold in an effort to stop runaway inflation, the devaluation of the U.S. dollar and the unceasing growth in federal government debt.
Here is H.R. 9157 in its entirety:
Here are two interesting extracts, giving us the "sense of Congress":
"The Federal Reserve note has lost more than 30 percent of its purchasing power since 2000, and 97 percent of its purchasing power since the passage of the Federal Reserve Act in 1913."
"Under the gold standard through 1913 the United States economy grew at an annual average of four percent, one-third larger than the growth rate since then and twice the level since 2000."
H.R. 9157 also notes that even with the Fed's 2 percent inflation mandate, over a 35 year period, the dollar will lose half of its purchasing power.
Under the Act, the Federal Reserve will have 30 months from the date of enactment to accomplish the following:
1.) define the Federal Reserve note dollar in terms of a fixed weight of gold, based on that day’s closing market price of gold.
2.) Federal Reserve banks shall make Federal Reserve notes redeemable for and exchangeable with gold at the fixed price and create processes that facilitate such redemptions and exchanges between member banks and the public.
If a Federal Reserve bank fails to meet its duties under the Act, the Secretary of the Treasury will make the redemption or exchange as guarantor and place a lien on all of the assets of the offending bank.
As well, under the Act, the Federal Reserve's Board of Governors and the Secretary of the Treasury must make public all gold holdings held by the Fed as well as reports of any purchases, sales, swaps, leases or any other financial transactions involving gold that took place since the "temporary" suspension of gold redeemability on August 15, 1971. As well, all records of transactions of United States gold in the ten years prior to August 15, 1971 must also be released to the public. Both of these have been secret for decades. Alex Mooney had requested information about U.S. gold reserves from Secretary of the Treasury Janet Yellen in 2021 with this letter:
Here is the reply from the Department of the Treasury which basically clarifies nothing but further exemplifies the secrecy when it comes to U.S. gold reserves:
H.R. 9157 has been referred to the House Committee on Financial Services by the House of Representatives, however, you can pretty much assure yourself that the powers that be in Washington and the Federal Reserve will, unfortunately, never let this bill progress past the debate stage given Washington's addiction to debt.
A recent speech by the General Manager of the Bank for International Settlements or BIS at the International Center for Monetary and Banking Studies gives us insight into where the central bank of central banks feels that the economy is heading. This information is particularly pertinent given that governments and some central bankers have been insisting that inflationary pressures are merely transient and that prices increases will settle down over the short-term.
Let's start by looking at a brief video of Agustin Carstens from October 2020 so that we can get a sense of where his sentiments lie:
Frightening, isn't it? But at least now we know his agenda.
Now, let's look at some key excerpts from his speech given on April 5, 2022 with my bolds throughout:
"After more than a decade of struggling to bring inflation up to target, central banks now face the opposite problem. The shift in the inflationary environment has been remarkable. If you had asked me a year ago to lay out the key challenges for the global economy, I could have given you a long list, but high inflation would not have made the cut.
This evening, I will describe the rise in inflation over the past year and discuss why this came as a surprise to many. I will argue that the pandemic and the extraordinary policy response laid the groundwork for a rapid and goods-intensive bounceback in demand which supply has been unable to fully meet. The war in Ukraine has further disrupted supply, particularly for commodities. I will also draw some broader lessons about the inflationary process – in particular, the need to look “under the hood” of aggregate data and models to understand how the behaviour of individual firms and workers drives inflation outcomes.
A key message is that we may be on the cusp of a new inflationary era. The forces behind high inflation could persist for some time. New pressures are emerging, not least from labour markets, as workers look to make up for inflation-induced reductions in real income. And the structural factors that have kept inflation low in recent decades may wane as globalisation retreats."
In other words, central bankers don't have a clue about what lies ahead for the economy.
Here is a graphic from the presentation showing how the global economy is entering a new reality that has not been experienced for four decades:
Carstens notes that 60 percent of the world's advanced economies have experienced year-over-year inflation above 5 percent which is more than 3 percentage points above the 2 percent target set by many central banks. He also notes that inflation has been rising in the world's emerging markets with more than half experiencing inflation rates that are above 7 percent.
Let's continue with his musings:
"At first, in early 2021, price increases were confined to a small number of items. Energy, food and durable goods, such as cars, are the most familiar examples. We tend to think of these as relative price changes resulting from shifts in demand and supply, many pandemic-induced. The items where supply and demand imbalances were concentrated had relatively flexible prices, allowing quick adjustments. Indeed, for a while it was possible to attribute all of the increase in inflation to these items, making it look transitory.
But higher inflation has become increasingly broad based. Since the start of 2021, the share of items in the consumption basket that have seen very large price rises has increased steadily. In particular, growth in service prices has accelerated. Because growth in service prices tends to be more persistent than that in goods, inflation may be becoming more entrenched."
Here is a graphic showing how inflation has broadened over time for both advanced and emerging economies:
Now, let's look at the three reasons why he believes that inflation has risen:
1.) The strong global rebound in aggregate demand: the global economy is expanding much more quickly than in the post-recession recoveries of recent decades.
2.) A persistent rotation in demand towards goods and away from services, particularly customer-facing ones. This trend has continued with supply growth being unresponsive to the higher demand. Staggered lockdowns and disrupted global value chains have revealed the fragility of the global "just-in-time" manufacturing systems.
3.) unresponsive aggregate supply, which has found it hard to keep up with surging demand.
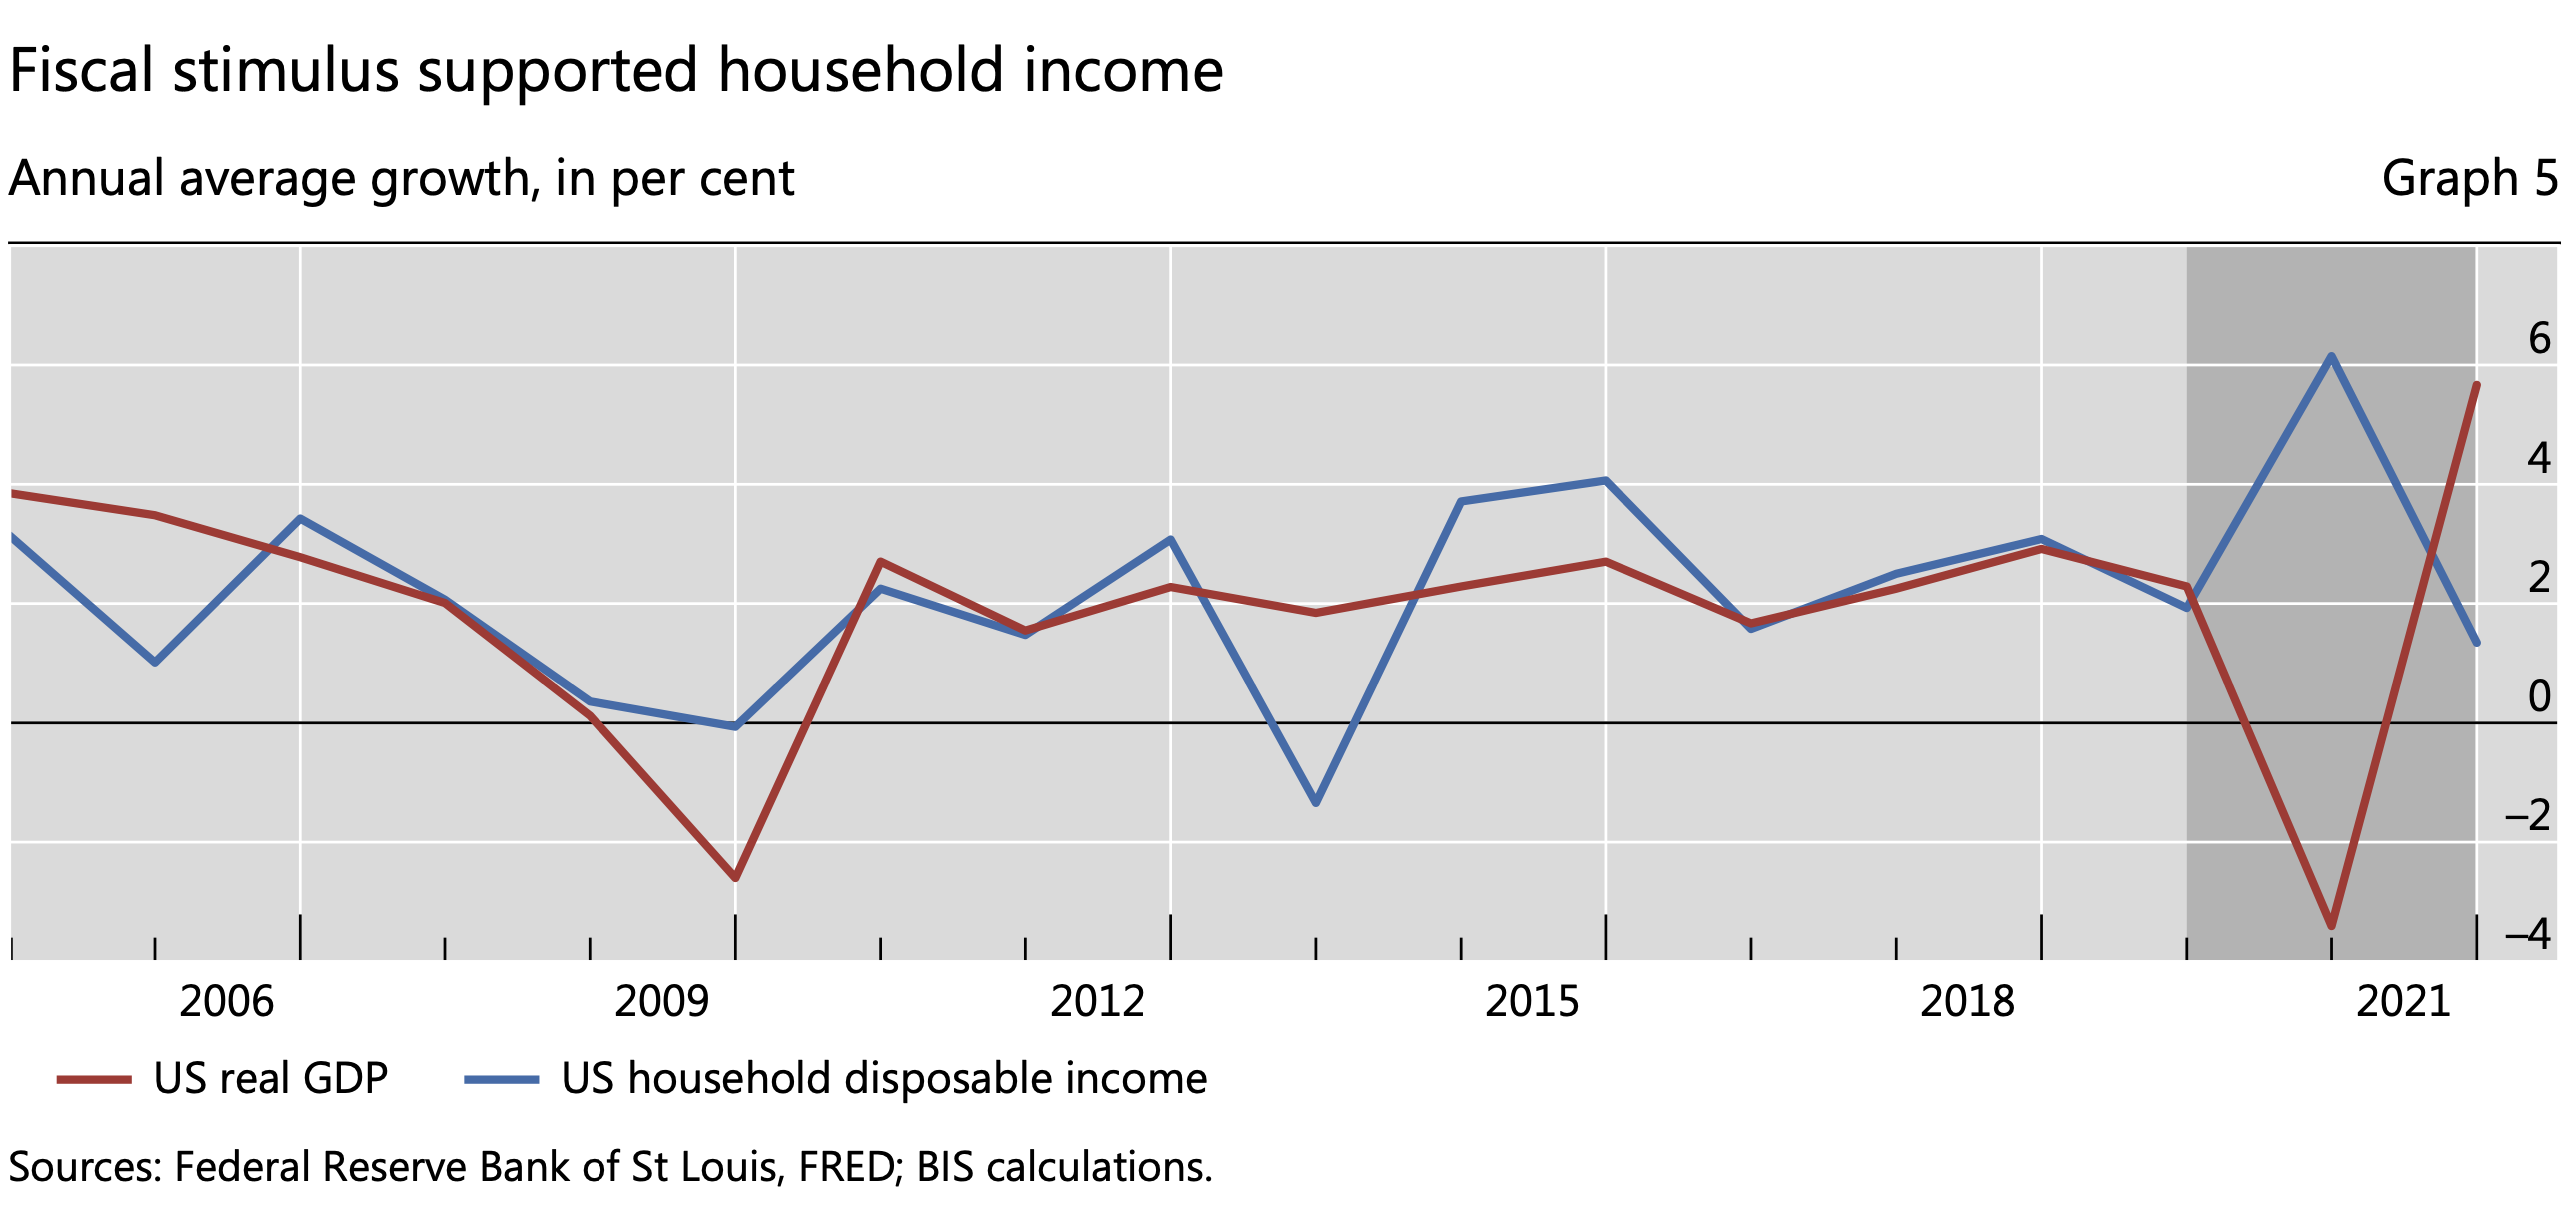
He states that the recovery from the pandemic was "remarkably fast", largely because economic activity was artificially repressed by government responses to the pandemic (i.e. lockdowns). It was the "exceptional policy response" that is responsible for this because governments used fiscal stimulus to support demand and central banks used monetary policies (i.e. expanding the supply of money) both of which have served as a springboard for the rapid post-pandemic economic expansion over the past year in particular. Here is a graphic showing how fiscal stimulus supported household disposable income:
Here, to me, is the key to the inflation dilemma, at least in the United States:
All of that new money has to have somewhere to go.
Carstens notes the following two lessons that need to be learned:
1.) "The distinction between relative price changes and inflation is critical, but not always clear-cut. In hindsight, it was too tempting to dismiss the initial rises in energy, food and car prices as a one-off adjustment to changed demand. We have learned once more that sector-specific shocks can spill into other sectors and become more persistent and pervasive.
This can happen directly or indirectly, through rising input costs that percolate down the value chain. Indeed, recent bottlenecks have been so keenly felt partly because they occurred in items at the start of production chains, which are needed to produce other goods and services downstream."
2.) "High- and low-inflation environments are very different. When inflation is high, price changes tend to be more aligned. Their common component explains a large share of the total variability of individual price changes. By contrast, in an environment of low and stable inflation, as in the last two decades, price changes in individual items – even large ones – percolate less into the prices of other items and, therefore, aggregate price indices. Put differently, when inflation is persistently low, much of what we measure as inflation is, in fact, the result of idiosyncratic price changes.
A consequence of this is that low-inflation environments tend to be largely self-correcting. Large price rises in individual items can increase inflation for a while. But if other prices don’t respond, inflation will eventually come down.
When inflation is less persistent, its influence on wage- and price-setting loses traction."
So, where to from here? Carstens notes that measures of long-term inflation have increased as shown here as projected by economic forecasters, financial markets and households:
One concern is that some households' inflation expectations have risen a lot and if that tendency spreads, central bankers will find it much harder to bring inflation back down. As well, as inflation starts to affect the cost of living, it is increasingly likely that a dangerous wage-price spiral could develop as consumers develop a mindset that they need significant wage increases to keep pace with price increases.
Here are Carstens' final comments:
"The good news is that central banks are awake to the risks. No one wants to repeat the 1970s. It seems clear that policy rates need to rise to levels that are more appropriate for the higher- inflation environment. Most likely, this will require real interest rates to rise above neutral levels for a time in order to moderate demand.
The adjustment to higher interest rates will not be easy. In many countries, starting conditions complicate matters. Households, firms, financial markets and sovereigns have become too used to low interest rates and accommodative financial conditions, also reflected in historically high levels of private and public debt. It will be a challenge to engineer a transition to more normal levels and, in the process, set realistic expectations of what monetary policy can deliver.
Nor will the required shift in central bank behaviour be popular. But central banks have been here before. They are fully aware that the short-term costs in terms of activity and employment are the price to pay to avoid bigger costs down the road. And such costs represent an investment in central banks’ precious credibility, which yields even longer-term benefits.
The shifts do underscore that central banks cannot single-handedly ensure global growth by keeping an accommodative stance in all conditions. Amid low inflation, this perception became commonplace. It is one central banks must continue to fight against, even more so in an inflationary environment."
In other words, get used to higher interest rates. They are coming whether we like it or not and the resulting pain for highly indebted consumers among the serf class is going to be substantial. We have been lulled into believing that the near-zero interest rate environment was permanent and have consumed with this as our reality. But, on the upside, the central bankers living among the sweaty masses will never have to worry about being unemployed no matter how pitiful the accuracy of their economic prognostications turn out.
In conclusion and as an aside, I found it particularly interesting/concerning that Agustin Carstens used the word "surprise" (or a derivation of the word) ten times throughout this brief speech. Doesn't that tell us everything that we need to know about central bankers and their understanding of the economy?
It is becoming increasingly apparent that high levels of inflation are impacting the world's food commodities. The United Nations Food Price Index which tracks the international prices of vegetable oils, meat, cereals, sugar and dairy products among others hit a record high in February 2022 according to the Food and Agriculture Organization, rising by 4 percent on a month-over-month basis and up 24.2 percent on a year-over-year basis as shown here:
...and here:
Note that these food price increases took place prior to the current military adventures taking place in Ukraine. The FAO notes that there are several factors behind the rise in food prices including concerns over crop conditions, adequate abilities to export food products, an increase in demand at the same time as there were supply-side issues.
The Russian invasion of Ukraine has the potential to significantly worsen the world's food production and price situation. According to the FAO, at least 12 percent of the world's food calorie exports pass through the Black Sea region. A recent report from the United Nations Conference on Trade and Development (UNCTAD) assess the impact of the military operations in Ukraine on trade and development given the fragile state of the global economy, particularly given the importance of both Russia and Ukraine to the world's food supply:
Together, the two nations represent the following share in key food items:
Here is a graphic showing the global dependance on agrifood commodities from Russia and Ukraine by nation:
Let's look at some of the world's most food-susceptible nations. If we focus on the market for wheat in Africa, between 2018 and 2020, African nations important $3.7 billion in wheat (32 percent of total African wheat imports) from Russia and an additional $1.4 billion from Ukraine (12 percent of total African wheat imports). As many as 25 African nations import more than one-third of their wheat from Russia and Ukraine and 15 of them import more than one-half of their wheat from Russia and Ukraine as shown on this graphic:
History has shown that civil unrest is often associated with food shortages and resultant increases in food prices. Africa is definitely on the front lines of the food issues that will face the world if Ukraine delays or completely misses the planting of this season's crops.
It is also important to keep in mind that Russia is a major supplier of agricultural chemical products including fertilizer (the world's largest producer) and its component ingredients as well as other crop nutrients. Over the past year, increases in fertilizerprices have already been partially responsible for much of the increase in food prices. With Russia's Ministry of Industry and Trade recommending that fertilizer exports be halted, the negative impact on yield of the world's food supply and further increases in food prices is almost guaranteed.
To show us how dire the food situation is across the globe, here is a summary of an analysis by the International Fund for Agricultural Development or IFAD showing the impact of price increases and other ripple effects of the Ukrainian conflict on some of the world's poorest communities:
1.) In Somalia, where an estimated 3.8 million people are already severely food insecure, the costs of electricity and transportation have spiked due to fuel price increases. This has a disproportionate impact on poor small-scale farmers and pastoralists who, in the face of erratic rainfall and an ongoing drought, rely on irrigation-fed agriculture powered by small diesel engines for their survival.
2.) In Egypt, prices of wheat and sunflower oil have escalated due to Egypt’s reliance on Russia and Ukraine for 85 percent of its wheat supply and 73 percent of its sunflower oil.
3.) In Lebanon, 22 percent of families are food insecure and food shortages or further price hikes will exacerbate an already desperate situation. The country imports up to 80 percent of its wheat from Russia and Ukraine, but can only store about one month’s worth of the crop at a time due to the blast in Beirut’s port in 2020 that destroyed the country’s major grain silos.
4.) Central Asian countries that rely on remittances sent home by migrant workers in Russia have been hit hard by the devaluation of the Russian ruble. In Kyrgyzstan, for example, remittances make up more than 31 percent of the GDP, the majority of which comes from Russia. Remittances are crucial for migrants’ families in rural areas to access food, education and other necessities.
Just in case you weren't aware, the World Bank's President David Malpass did warn people against hoarding food and gasolinebecause we can count on governments to be there to help us if we need it. I wouldn't bet on it if I were you.
The impact of the military operations and resulting increased sanctions environment that has been enacted on Russia will most certainly not favour the sweaty masses who consume the world's food supplies. Perhaps the self-appointed ruling class at the World Economic Forum will see its vision of the serf class surviving on a diet of insects and weeds come to fruition as more and more households in advanced economies find themselves unable to afford to eat, drive and heat their homes and are forced into a subsistence life style, something that Africans have long experienced.
Let's open this posting with a graphic
from a September 2017 Federal Reserve presentation that shows the history
of the year-over-year percentage changes in Personal Consumption Expenditures
inflation (PCE inflation):
As you can see, despite the Federal
Reserve's very best efforts, they have been unable to keep the inflation rate
much above their 2 percent target since the end of the Great Recession.
This seems to be cause for great concern as shown in repeated comments
from key Federal Reserve personnel, including current Fed Chair, Janet Yellen:
"...inflation as measured by
the price index for personal consumption expenditures (PCE) has generally run
below the FOMC's 2 percent longer-run objective since that goal was announced
in January 2012. Core inflation, which strips out volatile food and
energy prices, has also fallen persistently short of 2 percent.
Furthermore, both overall and core inflation, after moving up appreciably
last year, have slipped again in recent months. Sustained low inflation such as
this is undesirable because, among other things, it generally leads to low
settings of the federal funds rate in normal times, thereby providing less
scope to ease monetary policy to fight recessions. In addition, a persistent
undershoot of our stated 2 percent goal could undermine the FOMC's credibility,
causing inflation expectations to drift and actual inflation and economic
activity to become more volatile." (my bold)
While Ms. Yellen clearly states that
some of the uncertainty in inflation can be related to oil price drops, the
foreign exchange value of the U.S. dollar, slack in the labor market and "...idiosyncratic
developments unrelated to broader economic conditions...", whatever
that may be, recent research by two economists at the Federal Reserve Bank of
San Francisco have a reasonable explanation that may explain at least some of the lack of inflation in
the American economy.
The November 2017 FRBSF Economic Letter
by Tim Mahedy and Adam Shapiro entitled "What's Down with Inflation" takes a detailed
look at the spending categories that make up consumer spending, looking for
trends in all categories. They note that there are two categories of
goods and services as follows:
1.) Procyclical categories where
inflation has historically exhibited a trend that moves in tandem with the
economic cycle (i.e. as the economy expands, prices rise and as the economy
contracts, prices decline).
2.) Acyclical categories where
inflation has historically exhibited a trend that moves independently from the
economy.
Traditionally, economists use the Phillips curve to explain the relationship
between prices and the health of the economy using the rate of unemployment.
Here is an example of the Phillips curve for the period from 1961 to
1969:
Economist A. W. H. Phillips, studied
wage inflation and unemployment in the United Kingdom for the period between
1961 and 1957 and determined that there was a consistent relationship; when
unemployment was high, wages increased slowly and when unemployment was low,
wages rose rapidly. Other economists extended this relationship to
general price inflation and unemployment. While the relationship held
true for most of the 20th and early part of the 21st century, the relationship
has broken down since the Great Recession; with the present-day U.S. economy
basically at full employment, inflation should be much higher than it is
currently.
As I noted above, the authors of the
FRBSF Economic Letter looked at all of the individual sectors that make up the
U.S. economy and then placed each sector into one of two groups; procyclical or
acyclical as noted above. They found the following:
1.) Procyclical categories made up 42
percent of the PCE and include housing, recreational services, food
services and some nondurable goods.
2.) Acyclical categories made up 58
percent of the PCE and include health-care services, financial services,
clothing, transportation and a few smaller categories.
From this, the authors were able to
create inflation curves for both categories:
As you can see, during part of the
period between 1985 and the present, the two inflation series move together,
including the period between 2011 and 2013. After 2013, the two curves
diverge markedly with inflation in the acyclical categories dropping to one
percent or less as the inflation in the procycliical categories rose or
remained roughly steady at between 2 and 3 percent. While not a unique
occurrence over the 30 year-long period, this situation has not occurred since
the period between 1996 and 2002 when PCE inflation was between 5 and 9
percent.
Then authors then went on to look at
the contribution of each of the two categories to overall core PCE inflation
over the period between 2002 and 2017:
Procyclical categories are currently
contributing about the same to PCE inflation as they did in 2002 to 2007,
however, accylical categories are contributing about 0.6 percentage points less
than they were in the early part of the new millennium.
The authors go on to break down the
acyclical sectors of the economy to see which one(s) account for low
inflation. They found that health-care services, which account for about
35 percent of acyclical inflation and 20 percent of core PCE inflation, are
responsible for much of the decline in core PCE inflation as shown here where
the deviation from the benchmark inflation rate is marked as a solid black line
and the blue bars denote the weighted contribution to the deviation in
inflation from the health care sector:
As well, you should note that in 2017,
there has been a substantial contribution to low acyclical inflation from
categories that are not related to health care, more specifically, a decline in
the prices of cell phone services.
The authors observed the following:
1.) health care services inflation
averaged 3.5 percent annually in the mid-2000s
2.) health care services inflation
averaged 1.1 percent over the past five years
Why is this? The authors suggest
that the persistent decline in health care services inflation is related to legislated
changes in Medicare payments, including the changes mandated by the Affordable
Care Act. According to the Centers for Medicare and Medicaid Services,
Medicare payments are set to grow at 2.0 percent in the 2018 fiscal year
compared to 0.6 percent in fiscal 2017 and 0.9 percent in fiscal 2016.
This means that the projected increase in Medicare payments could
translated into as much as a 0.3 percentage point increase in overall health
care services inflation but only a 0.05 percentage point increase in core PCE
inflation.
Health care services are now
contributing about 0.3 percentage points less to core PCE than prior to the Great Recession; if health care
services inflation was at the levels experienced during the early- and
mid-2000s, core PCE inflation would have been above 2 percent for most of the
post-Great Recession period, putting inflation within the Federal Reserve's
comfort zone.
This interesting analysis may explain at least part of the current low official inflation rate (your personal experience may vary!). In any case, given central bankers
abhorrence for deflation, the Federal Reserve's concerns over
the current stubbornly low inflation environment is warranted. With
consumer expenditures accounting for nearly 69 percent of the U.S. economy as
shown here:
...any deflationary pressures that
exist will result in consumers postponing spending since they expect that
prices for those all important consumer goods will be cheaper in the future
and, according to central bankers, that is a bad, bad thing!
I have been an avid follower of the world's political and economic scene since the great gold rush of 1979 - 1980 when it seemed that the world's economic system was on the verge of collapse. I am most concerned about the mounting level of government debt and the lack of political will to solve the problem. Actions need to be taken sooner rather than later when demographic issues will make solutions far more difficult. As a geoscientist, I am also concerned about the world's energy future; as we reach peak cheap oil, we need to find viable long-term solutions to what will ultimately become a supply-demand imbalance.




 Posts
Posts


