Thursday, April 29, 2021

Bill Gates and His Carbon Footprint

With Bill Gates seeming to be everywhere and an expert in everything over the past year and with the recent release of his 2021 book on avoiding a climate disaster, a look back at research from October 2019 gives us a real sense of his actual, "boots on the ground" commitment to the reduction of greenhouse gases.


First, let's look at one of Bill Gate's preferred modes of travel:


Why on earth would you want to sully yourself by sharing a flying aluminum tube with the sweaty masses when you can board your very own private jet?


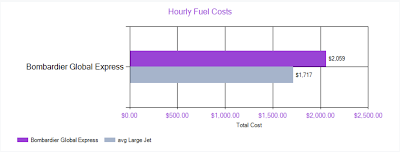
The Bombardier BD-700 is owned through Challenger Administration LLC and has hourly fuel costs of this:


Somewhat hypocritically, Gates flew in his private jet to the 2015 Paris Climate Summit:


Gates, the world's foremost untrained climatologist (along with his expertise in vaccines, viruses and everything but software that actually works) lives in this 66,000 square foot home:


Now that we have a very basic understanding of Bill Gates' personal tastes, let's look at the 2019 study by Stefan Gossling entitled "Celebrities, air travel and social norms".  The author opens by noting that frequent air travel is linked to a disproportionately large carbon footprint and plays a key role in carbon inequality, a concept which describes the massive differences in individuals' contributions to greenhouse gas emissions.  Flying is considered to be a very energy intensive means of transportation with frequent fliers contributing a significantly higher portion of total greenhouse gas emissions.  For example, Gossling's 2009 study found that 5 percent of France's total population was responsible for 50 percent of total emissions from transportation and a 2010 study by Brand and Prison found that 20 percent of the most frequent travellers contributed 60 percent of transportation-related greenhouse gas emissions.  There is also a link between income and transportation emissions; the highest income groups in the United Kingdom produced emissions that were 3.5 times higher than the lowest income groups, mainly as a restful of increased mobility.


The authors goes on to note that the world's most affluent people have significantly different travel patterns than the rest of humanity; they tend to move more frequently, have access to private transportation and have multiple real estate holdings.  This is particularly the case for celebrities and, given the fact that they need to keep their "brand" in the spotlight, means that they tend to travel more frequently than the sweaty masses.


Celebrities often adopt a "climate friendly" persona as a means of appealing to their followers, however, there are a wide range of celebrity climate types as shown on this table:


Since celebrities often use social media sites to engage with their fan base, the information provided can be used to track and study the movements of these individuals.  The author used the combined Facebook, Instagram and Twitter accounts of ten celebrities with the individuals being chosen to represent various celebrity types including business leaders, models, designers, singers, actors, athletes etcetera.  The celebrities were also ranked according to the completeness of their travel data with some posting on their social media accounts very frequently and others posting intermittently with large gaps in time.  


Here is a table showing the celebrities and the completeness of their social media posting data:


To calculate the distances flown, great circle distances were calculated for each trip reported by each of the celebrities noting that not all trips were identified and that stop-overs may not have been communicated to the public.  For scheduled air travel it was assumed that the celebrities will fly in business or first class.  Fuel use per hour was calculated for celebrities who used private aircraft multiplied by the humber of hours of flight time (excluding taxying time, waiting times and maintenance) and return or outbound trips that were "empty" (the celebrity was being picked up or dropped off) were not included.


Here is a list of celebrity use of aircraft and per hour fuel consumption:


Andre Schurrle - scheduled air travel - 67.8 kg


Bill Gates - Bombardier BD-700 - 1453 kg


Emma Watson - scheduled air travel - 67.5 kg


Felix von der Laden - scheduled air travel - 67.5 kg


Karl Lagerfeld - various private jets - 1400 kg


Mark Zuckerberg - company private jet - 1400 kg


Meg Whitman - company private jet - 1400 kg


Oprah Winfrey - Gulfstream G650 - 1406 kig


Paris Hilton - various private jets - 1400 kg


Here is a table showing flight activity in 2017 for the ten celebrities:


As you can see, Bill Gates had the longest total flying distance and the most total flight time in hours for 2017.  This is what his flight patterns looked like:


Finally, here is a table showing the total fuel consumption and tonnes of CO2 emissions for each celebrity:


According to Gossling's calculations, by a wide margin, Bill Gates has the largest carbon footprint related to air travel.  It would be interesting to know how one of the world's leading untrained climatologist can justify his very significant personal contributions to the issue of greenhouse gas emissions. 


Let's close with this conclusion from the author:


"Worldwide, climate policies have focused on the decarbonization of production. This ignores highly skewed contributions to emissions between individuals within countries, and the very significant contributions to global emissions made by celebrities and other cultural, economic, and political elites. As there is a growing class of affluent people, as well as populations aspiring to energy-intense lifestyles, celebrities question progress on mitigation while also shaping moral and social norms that oppose far-reaching climate policies.


In this context it is important to bear in mind that aspirational lifestyles exist on very different scales. Politicians set social norms for voters; business leaders for employees; professors for students. Where these norms involve mobility, they will often be misaligned with societal goals for mitigation. It will be of interest to study these developments in greater detail, as they underlie society’s ability to decarbonize economies, both through political means and behavioral change."


It has become increasingly apparent that the new global reality is comprised of "rules for thee but not for me" when it comes to the global ruling class.
 

Tuesday, April 27, 2021

India, COVID and Mainstream Media Truthiness

While India is garnering the mainstream media's ceaseless attention to all things COVID, there are a couple of things that we need to consider.


First, here is a graph from Our World In Data showing the number of cumulative COVID-19-related deaths per million people for the United States, the United Kingdom and India:


As you can see, India totally missed the first and second waves of COVID-19-related deaths which peaked at 0.18 percent in the United Kingdom in January 2021, 0.104 percent in the United States also in January 2021.  Currently, India's COVID-19 death rate is 0.018 percent, roughly one-tenth of the peak death rate of the United Kingdom.  Certainly, the death rate in India will increase as time passes but, as you can see, currently it is well below the rates experienced in two of the world's most affected nations and, as shown here, has relatively little to do with where the advanced economies of the world are headed.  Interestingly, we'll never see this reported in the mainstream media.


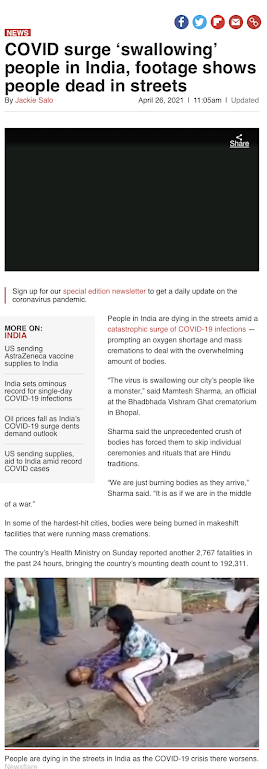
As well, thanks to the internet archive, here is a screen capture taken from a sad and rather alarming story that appeared in the New York Post on April 26, 2021:


Here is a closeup of the photo which appeared in the article purporting to show an Indian woman "dying" in the street of COVID-19:


Oddly enough, you can see the same woman wearing purple clothing lying on the sidewalk while the young woman in the multi-coloured top and white pants with a dark stripe in this photo:


The only problem is that this photo was found in a news story on Sky News dated May 7, 2020 reporting on a gas leak at an LG Polymers plant located in Andhra Pradesh:


So, either the same ill woman in India was lying on the sidewalk wearing the same clothing and being attended to by the same young woman nearly 12 months ago as a result of a gas leak and was ill yet again in late April 2021 due to COVID-19 or the mainstream media is lying to us or just doing sloppy reporting.


Fortunately for us all, the New York Post posted this small retraction at the bottom of the edited story, blaming Reuters for their misstep/sloppiness:


This begs the question; how often has this happened in the past year when it comes to reportage on the pandemic?


If there is one thing that the world has taught us in the past year it's that we are living in a post-truth era where the mainstream media has become a big part of propagating a false, government-created narrative that is being used to stoke fear and keep us all in line.


The Impact of Non-Pharmaceutical Interventions on the Spread of COVID-19 - A Lesson from South Korea and Sweden

One of the most severe and unprecedented government responses to the COVID-19 pandemic has been the use of stay-at-home orders and government-forced business and school closures among others.  While governments would have us believe that these measures have been successful at reducing the spread of COVID-19, until now, there has been little research into the effectiveness of these two most restrictive non-pharmaceutical interventions or NPIs.  Thanks to research by Eran Bendavid, Christopher Oh, Jay Bhattacharya and John Ioannidis at Stanford University, we now have an evaluation which compares the use of less restrictive NPIs or lrNPIs and more restrictive NPIs or mrNPIs on the spread of COVID-19.


The use of non-pharmaceutical interventions was justified by governments around the world to reduce the transmission of COVID-19 in the absence of pharmaceutical options (i.e. vaccines etcetera) thereby reducing death, disease and health system overloading.  The early adoption of the most restrictive NPI policies (also known as lockdowns) was justified at the beginning of the COVID-19 pandemic as the disease spread rapidly and overwhelmed national and local health systems.  That said, it has become apparent that the most restrictive NPIs had a series of unintended but related health consequences including hunger, increase in non-COVID-19 diseases from missed health appointments, higher rates of opioid overdose deaths, mental health issues including suicide and higher rates of domestic abuse.  Some of these health consequences are related to the significant negative economic impacts of the lockdown measures.  To better weigh the real world benefits of non-pharmaceutical interventions, one must balance the positives and the negatives. 


For the purposes of the study, the authors used data from ten nations as follows: England, France, Germany, Iran, Italy, Netherlands, Spain, South Korea, Sweden and the United States.  The authors used South Korea and Sweden as examples of nations with less restrictive policies (lrNPIs) and compares the impact of their modest responses on the spread of COVID-19 to nations with more restrictive policies (mrNPIs).  South Korea's strategy relied on isolation of infected cases and their contacts and intensive investments in both testing and contact tracing.  In the case of Sweden, the government implemented only social distancing guidelines, discouragement of domestic and international travel and a ban on large gatherings.  The results obtained by Sweden and South Korea are then compared to the nations with more restrictive NPIs. 


In their research, the authors note that the average growth rate in new cases of COVID-19 prior to the imposition of any NPIs was positive in all ten nations with an average of 32 percent.  Here is a list of each nations' daily case growth rate prior to the imposition of any non-pharmaceutical measures:


England: 23 percent


France: 35 percent


Germany: 32 percent


Iran: 42 percent


Italy: 36 percent


Netherlands: 47 percent


Spain: 23 percent


USA: 28 percent


South Korea: 25 percent


Sweden: 33 percent


Among the ten nations in the study, government-imposed non-pharmaceutical responses to the pandemic, government measures included national lockdowns, social distancing, school closures, religious closures, paid sick leave, quarantining of positive cases, working from home, no public gatherings, no private gatherings, home isolation, domestic and international travel bans, transit suspensions, 


Now, let's look at the effect of more restrictive NPIs (mrNPIs) on daily growth case rates after accounting for the effects of less restrictive (lrNPIs) in South Korea and Sweden (i.e. comparing the effectiveness of the lockdowns in the eight nations when compared to South Korea and Sweden): 


England: 


+16 percent compared to South Korea

+23 percent compared to Sweden


France: 


+7 percent compared to South Korea

+13 percent compared to Sweden


Germany:


-1 percent compared to South Korea

+5 percent compared to Sweden


Iran: 


-7 percent compared to South Korea

-2 percent compared to Sweden


Italy:


+3 percent compared to South Korea

+8 percent compared to Sweden


Netherlands:


-3 percent compared to South Korea

+1 percent compared to Sweden


Spain: 


+24 percent compared to South Korea

+30 percent compared to Sweden


USA:


+8 percent compared to South Korea

+14 percent compared to Sweden


As you can see, the only nation with a decrease in the growth rate of COVID-19 cases when compared to both South Korea and Sweden is Iran and even that is minimal with a 7 percent decrease when compared to Sweden and a 2 percent decrease when compared to South Korea.  In 12 out of 16 of the comparisons, the point estimates are positive, that is, the imposition of more restrictive non-pharmaceutical measures resulted in increased daily growth rate in cases. 


It has become increasingly apparent that, as the pandemic grinds into its 14th month, some governments are imposing even stricter measures in a desperate attempt to force down the growth rate of new COVID-19 cases, doubling down on measures that obviously have failed to prevent the growth in the number of COVID-19 cases over the past year.  This research clearly shows that the imposition of stricter measures like lockdowns, shuttering of schools, churches and businesses and restrictions in the number of individuals that can meet each other has been a colossal failure and that the examples of both South Korea and Sweden show clearly that the imposition of minimal non-pharmaceutical measures has worked quite well at controlling the rate of spread of the 2019 edition of the novel coronavirus when compared to the randomly issued mandatory edicts of governments.  While governments seem oblivious to reality, their mandatory lockdowns and shutterings have had a massive negative impact on the economy and the physical and mental health of their citizens that may have been worse than if they had imposed no non-pharmaceutical interventions whatsoever. 


Monday, April 26, 2021

The Technology Tyrants - How to Buy Influence in Washington

As I have said before, Washington is for sale and Corporate America has proven itself quite willing to buy politicians at just about any cost.  A recent study by Public Citizen, a "nonprofit consumer advocacy organization that champions the public interest in the halls of power" examines two of the largest lobbyists in the hallowed halls of the nation's capital as shown here:  


This report is particularly pertinent given the growing power of the technology sector with its near monopoly on social media outlets and the current political and health (i.e. COVID-19) narrative and, in the case of Amazon, its growing presence as the world's retailer.


The authors of the study used data provided by the Center for Responsive Politics (i.e. Open Secrets) to analyze how Big Tech has "blanketed Capitol Hill with lobbyists and lavished members of Congress with campaign contributions", in other words, buying influence in Washington that far outstrips the meagre to basically nonexistent influence that voters have on lawmakers....other than casting their vote.


Let's look at a bit of history.  Back in 2010, when associations, federations, trade groups and other consolidated corporate spenders are excluded, there was not a single big technology company represented among the top eight lobbyists unless you include Verizon Communications.  In 2017, Google (Alphabet Inc.) rocketed to the top of the list and was the only technology sector representative followed by the usual defense sector players.  In 2020, this changed substantially as shown on this table:


Here is another table showing how much each of these corporations spent on lobbying in 2020:


Here is a graphic that looks back in time at the growth in lobbying expenditures for both Facebook and Amazon compared to two of the more influential members of Corporate America in the past:


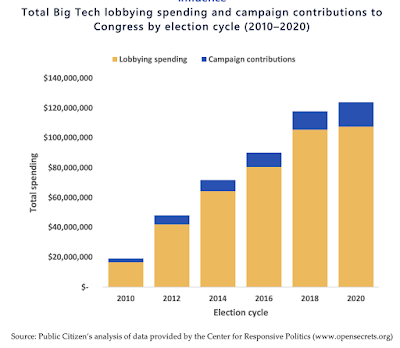
Now, let's look at overall spending by Big Tech on both lobbying and campaign contributions going back to 2010:


During the 2020 election cycle, Big Tech spent 5.2 percent more on lobbying and campaign contributions than it did during the 2018 cycle, hitting a total of $108 million in lobbying 2020.  


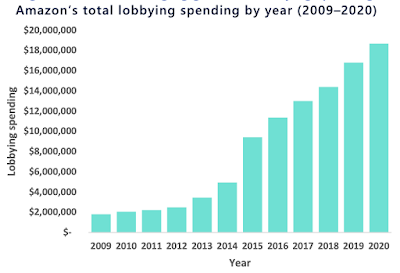
Let's look at the two biggest technology sector lobbyists and how their spending on lobbying has grown over the past decade:


1.) Amazon:


2.) Facebook:


There is an upside; all of this lobbying creates jobs for one sector of the economy, lobbyists as follows (for 2020):


1.) Amazon - 117 lobbyists


2.) Google - 97 lobbyists


3.) Facebook - 71 lobbyists


4.) Apple - 48 lobbyists


In 2020, the biggest tech sector behemoths retained the services of 333 lobbyists, up from less than 100 a decade earlier.  It is also important to note that half of the top ten lobbyists who contributed amounts ranging from a paltry $324,258 to a more substantial $571,744 just happened to be lobbyists representing Big Tech in 2020 as shown here:


Big Tech also shelled out $3.2 million in campaign funds for representatives on four key Congressional committees that hold jurisdiction over antitrust and privacy legislation including the House Judiciary Committee, the House Energy and Commerce Committee, the Senate Committee on the Judiciary and the Senate Committee on Commerce, Science and Transportation as shown here:


In general, more of the funds went to Democratic members of these Congressional committees with $1.678 million going to the Democratic members and $1.409 million going to the Republican members.


Given the dominance of the American technology sector oligopoly, it is not terribly surprising that Big Tech and its lobbyists are willing to throw around tens of millions of dollars to ensure that Washington sees things its way.  Let's close with this quote from the paper's conclusion:


"Big Tech’s increasingly dominant role in our economy and everyday lives is worsening social problems that need a political response. Yet as Big Tech converts its enormous economic and social power into political influence, our political system is hamstrung from addressing those increasingly serious issues. This problem is reflective both of Big Tech’s extraordinary wealth and power and a broken political system that works for giant corporations but not the rest of us. It is not susceptible to easy solutions.


As I said at the beginning of this posting, Washington is for sale and Corporate America, particularly the technology tyrants, are in a buying mood.


Thursday, April 22, 2021

Drug Overdose Deaths in America - Another Unintended Consequence of Government's Response to the Pandemic

In its most recent data release, the Centers for Disease Control and Prevention outlines one of the most serious health issues facing the United States, an issue which has worsened significantly since the onset of the COVID-19 pandemic one year ago.  While I have posted on this subject in the past few months, it is important for us to understand how government's response to the pandemic continues to have a negative and far-reaching impact on certain subgroups of Americans.


Here is a graph showing the 12 month-ending provisional number of drug over deaths for the entire United States with the circles showing the predicted number of drug overdose deaths and the solid line showing the actual number of overdose deaths:


In the 12 month period ending in September 2020, the last month for which data is available, there were 87,203 drug overdose deaths, up from 68,757 in the year prior to September 2019 (i.e September 2018 to September 2020), an increase of 26.8 percent.


Here is a graphic showing the 12-month-ending provisional number of drug overdose deaths by drug type or drug class:


By drug type or drug class, the month-ending provisional number of drug overdose deaths were as follows 


1.) Opioids - 64,472


2.) Synthetic Opioids excluding methadone - 53,877


3.) Psychostimulants with abuse potential - 21,961


4.) Cocaine - 19,239


5.) Heroin - 13,780


6.) Natural and semi-synthetic opioids - 13,122


7.) Methadone - 3,361


In comparison, in September 2019, the 12-month-ending provisional number of drug overdoses from opioids was 48,140 and from synthetic opioids was 34,057. 


Here is a graphic showing the predicted percent change in drug overdose deaths between September 2019 and September 2020:


Here is a table showing the 9 states with the most drug overdose deaths:


Here is a table showing the 10 states with the least drug overdose deaths:


Here is a table showing the 10 states with the greatest percentage increase in drug overdose deaths:


Here is a table showing the 10 states with the lowest percentage increase in drug overdose deaths:


It is quite clear that the pandemic has had a significant and ongoing impact on the number of drug overdose deaths in the United States, thanks in large part to the government-ordered closures of treatment programs, drop-in centers that provide safe injection sites and naloxone.  For example, a 2020 study by Sara Glick et al found that 43 percent of Syringe Services Programs (SSP) reported a decrease in the availability of services due to COVID-19 including 25 percent that reported that one or more of their sites had closed due to the pandemic.  


Let's close this posting with the conclusion from Glick's analysis which clearly outlines the issue:


"While SSPs are to be admired for their resiliency and ingenuity in the present COVID-19 pandemic situation, the problems presently facing SSPs must not be underestimated. Clients are likely to have great difficulty social distancing and “staying at home;” most will need to obtain drugs to avoid withdrawal and many remain homeless. Many SSPs have closed and those that remain open have greatly reduced their services, are struggling to procure sufficient PPE for staff, and have been forced to reduce testing for blood borne pathogens, a change that could lead to increasing rates of HIV and HCV among an already vulnerable population."


The rising number of drug overdose deaths in the United States over the past year is yet another  in a long line of unintended consequence of the governments' response to the COVID-19 pandemic. 


Wednesday, April 21, 2021

The Next Step in the Global Reset - Resetting the Monetary System

On April 19, 2021, this statement appeared on the Bank of England's website:


The Bank of England will work together with the United Kingdom's Her Majesty's Treasury to explore the implementation of a potential United Kingdom Central Bank Digital Currency or CBDC.  This move is not unexpected given that other central banks around the world are exploring or experimenting with digital currencies.


Let's start by putting digital currencies into perspective.  According to Michael Casey, Chief Content Officer at CoinDesk, the panel moderator at the recent Davos Agenda Resetting Digital Currencies session:


"We're talking about the disruption of money.  A technology so deeply-rooted into the structure of society that we so often just take it for granted....This isn't just another digital upgrade to our existing bank centric  system of money.  With digital currencies, the money itself is software.  It's programmable and when that happens, a lot of our assumptions about what money is and how it functions may need to be reexamined."


Now, let's go back to the Bank of England's statement.  Here is a quote from the statement:


"A CBDC would be a new form of digital money issued by the Bank of England and for use by households and businesses. It would exist alongside cash and bank deposits, rather than replacing them.


The Government and the Bank of England have not yet made a decision on whether to introduce a CBDC in the UK, and will engage widely with stakeholders on the benefits, risks and practicalities of doing so.


The Taskforce aims to ensure a strategic approach is adopted between the UK authorities as they explore CBDC, in line with their statutory objectives, and to promote close coordination between them. The Taskforce will: 


1.) Coordinate exploration of the objectives, use cases, opportunities and risks of a potential UK CBDC.


2.) Guide evaluation of the design features a CBDC must display to achieve our goals.


3.) Support a rigorous, coherent and comprehensive assessment of the overall case for a UK CBDC.


4.) Monitor international CBDC developments to ensure the UK remains at the forefront of global innovation.


The Bank of England will also set up two forums as follows:


"1.) A CBDC Engagement Forum to engage senior stakeholders and gather strategic input on all non-technology aspects of CBDC. The Forum will have an important role in helping the Bank and HM Treasury understand the practical challenges of designing, implementing and operating a CBDC. It will consider issues such as – but not limited to – ‘use cases’ for CBDC, functional needs of CBDC users, roles of public and private sectors in a CBDC system, financial & digital inclusion considerations, and data & privacy implications. Members will be drawn from financial institutions, civil society groups, merchants, business users and consumers.


2.) A CBDC Technology Forum to engage stakeholders and gather input on all technology aspects of CBDC from a diverse cross-section of expertise and perspectives. The Forum will have an important role in helping the Bank to understand the technological challenges of designing, implementing and operating a CBDC. Members will be invited by the Bank and drawn from a range of financial institutions, academia, fintechs, infrastructure providers and technology firms."


In March 2020, the Bank of England released a discussion paper on CBDCs.  The discussion paper noted that a Central Bank Digital Currency would be an electronic form of central bank money that could be used by households and businesses to make payments and that the monetary system in the United Kingdom would change as follows:


"Any CBDC issued by the Bank of England would be denominated in pounds sterling just like banknotes and would be introduced alongside rather than replacing cash and bank deposits.  It would not be a cryptocurrency."


One of the reasons for the Bank's interest in CBDC is because methods of payments are changing as shown in this graphic:


Here is a quote from the discussion paper:


"The use of banknotes - the Bank’s most accessible form of money – is declining, and use of privately issued money continues to increase, with technological changes driving innovation. 


These developments provide the public with new ways to pay for goods and services, which support and enable the digital economy, but also present new risks. 


They raise an important question for the Bank: 


As the issuer of the safest and most trusted form of money in the economy, should the Bank provide the public with electronic money – or a Central Bank Digital Currency (CBDC) – as a complement to physical banknotes?"


Here is a graphic showing the declining use of physical currency, one of the alleged drivers behind the move to CBDCs:


Now, let's "follow the money".  The World Economic Forum/Davos Overlords have long had an interest in digital currencies as shown here:


The January 2021 Davos Agenda featured two sessions about Resetting Digital Currencies as shown here:


Note the presence of the current Governor of the Bank of England, Andrew Bailey, among the speakers at this session:


Here is a video of the Session 1 panel:


Here is a video of the Session 2 panel:


There is also a very significant additional connection between Central Bank Digital Currencies, the Bank of England and the World Economic Forum as shown here:


So, there you have it.  Mark Carney, former Governor of the Bank of England (2013 to 2020) and the Bank of Canada just happens to be a member of the Board of Trustees of the World Economic Forum.


Given the Bank of England's current foray into exploring the development and implementation of a digital currency and its links with the World Economic Forum and its elite leadership, one of the great cheerleaders of the digital currency movement, we can pretty well assure ourselves that digital currencies are going to be a bedrock of the economy in the not-too-distant future.  While the Bank of England states that physical currency will circulate as it is now, my prediction is that physical currency will completely disappear, allowing the ruling class to further control our behaviours and track our spending.


Let's close with the opening comments from World Economic Forum insider Michael Casey as I noted above as a reminder of where we are headed:


"We're talking about the disruption of money.  A technology so deeply-rooted into the structure of society that we so often just take it for granted....This isn't just another digital upgrade to our existing bank centric  system of money.  With digital currencies, the money itself is software.  It's programmable and when that happens, a lot of our assumptions about what money is and how it functions may need to be reexamined."