The United States Department of the Treasury recently released the 2023 year end version of the Financial Report of the United States which provides decision makers and citizens with a snapshot of the nation's fiscal health. Needless to say and not overly surprisingly, the situation looks rather dire. In this posting, I'll provide you with some summary graphics and commentary from the report and let you decide for yourself what the fiscal future of the United States looks like.
The first table outlines Washington's overall fiscal reality noting that the dollar amounts are in billions (i.e. $1000 billion equals $1 trillion):
The budget deficit for fiscal year (FY) 2023 increased by 23.2 percent or $319.7 billion to $1.695 trillion from the previous fiscal year. Taxes and other revenues decreased by 9.3 percent or $460.3 billion to 4.466 trillion from the previous fiscal year. thanks to a decline in individual income tax and tax withholdings, a decline in corporate income taxes and decreased deposits of earnings for the Federal Reserve due to increased interest rates as you can see on this chart:
Total liabilities excluding Medicare and Social Security shortfalls grew by 9.9 percent or $3.876 trillion on a year-over-year basis, reaching $42.898 trillion. Here is a chart showing the breakdown of Washington's liabilities:
Again, it is important to remember that this total liability of nearly $43 trillion does not include the shortfall in funding of both Medicare and Social Security which looks like this in the case of Social Security:
It also does not include intergovernmental debt which, when added to the total liabilities of $42.898 trillion would add an additional $7.09 trillion to the total debt as shown here (with a comparison to 2014):
Here is a chart showing the U.S. budget deficit and net operating costs (revenues vs. costs) for the past five fiscal years:
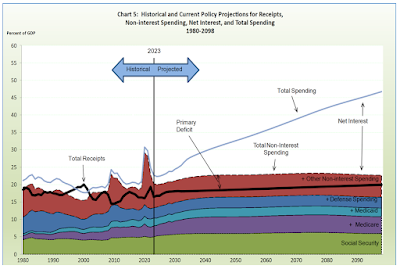
Here is a very sobering chart showing the projected federal spending and receipts out to 2098 observing that the analysis includes no recessionary periods in the future:
The growth in spending on net interest in the debt is frightening to say the least with net interest costs rising to roughly the same level as all other government spending over the next 75 years.
Lastly, here is a chart showing the historical and projected debt-to-GDP levels between 1980 and 2098:
At the end of fiscal 2023, the debt-to-GDP level was approximately 97 percent and, under current fiscal policies and the projections based on assumptions in the report, will reach 531 percent in 2098. Here is a table showing the 75-year fiscal gap (i.e. how much primary deficits must be reduced or how much primary surpluses must grow over the next 75 years to make fiscal policy sustainable) and how delays will make the spending decreases and tax increases even more painful and time passes:
Let's close with two quotes taken directly from the report:
"The projections in this Financial Report show that current policy is not sustainable."
"The longer policy action to close the fiscal gap is delayed, the larger the post-reform primary surpluses must be to achieve the target debt-to-GDP ration at the end of the 75-year period. Future generations are harmed by a policy because the higher the primary surpluses are during their lifetimes, the greater is the difference between the taxes they pay and the programmatic spending from which they benefit."
In other words, all that decision makers in Washington are doing today is kicking the federal debt crisis further and further down the road without making the difficult decisions necessary for responsible spending. No one in bought and sold Congress is willing to do the heavy lifting and force the federal government to live within its means. As the authors of the report note, Washington's current fiscal reality is nothing more and nothing less than unsustainable.


No comments:
Post a Comment