Showing posts with label consumer credit. Show all posts

Thursday, August 20, 2015

How the Federal Reserve Has Lulled Consumers Into a False Sense of Credit Reality

Updated May 2016

Consumer debt levels are becoming increasingly worrisome, an observation that is not terribly surprising given the long-term impact of the Fed's ultra-low interest rate policy that is specifically designed to get consumers to spend, spend spend. 

Let's start by looking at what has happened to overall household debt levels as of March 31, 2016 from the New York Federal Reserve Bank:


At the end of Q1 2016, non-housing debt (in pink) reached $3.4 trillion on top of $8.85 trillion in housing debt (in blue).  While overall household debt is 3.3 percent below its peak of $12.68 trillion in Q3 2008, non-housing debt is now at the highest level that it has been since Q1 2004.  In fact, non-housing debt peaked at $2.71 trillion in Q4 2008 during the Great Recession and dropped to a post-Great Recession low of $2.56 trillion in Q2 2010.  Since its low in 2010, non-housing debt has risen by $840 billion or 32.8 percent.

Let's focus on non-housing debt and then take a closer look at credit card debt.  Here is a graph from the Philadelphia Federal Reserve showing how total revolving and non-revolving consumer credit has reached a 24 year high:


In the first quarter of 2015 (the latest data available), total outstanding consumer credit reached $3.364 trillion which is composed of $890.9 billion in revolving credit and $2.473 trillion in non-revolving debt.  This is up $811.9 billion or 31.8 percent from the Great Recession low of $2.552 trillion in 2009.

According to Tim Chen at Nerdwallet and based on an analysis of Federal Reserve statistics, an average American household had the following consumer debt in July 2015:

Credit card debt: $7400
Mortgage debt: $156,584
Student Loan debt: $33,090

If the households that have no credit card debt are removed from the equation, the average outstanding credit card debt more than doubles to $15,863.

As we can see on this graph, the number of credit card accounts (in blue) has risen to its highest level since the Great Recession:


As well, the number of credit accounts opened (in blue) and number of credit inquiries (in green) have risen to or just below new post-Great Recession highs:
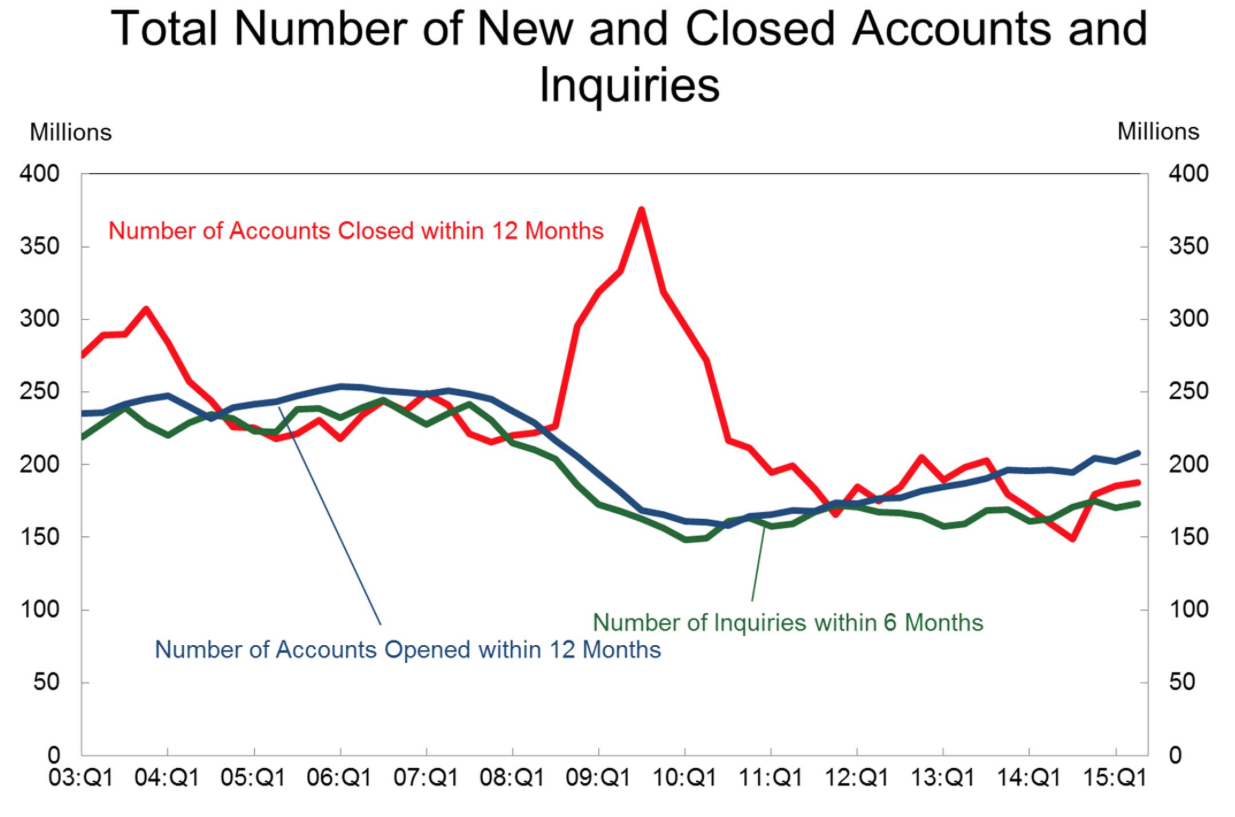

Over the second quarter, the number of credit inquiries rose by 3 million to 173 million.  This is a key indicator of consumer non-housing credit demand and would suggest that consumers are feeling rather confident.

In the second quarter of 2015, credit card balances increased to $703 billion with 8.4 percent of balances delinquent by 90 days or longer.  Here is a graph showing how the percentage of credit card delinquent balances (in blue) have begun to rise over the last two quarters:


While the level of delinquencies is still well below the levels seen in early 2010, as Tim Chen points out, credit card indebtedness and delinquency levels are connected to a significant increase in credit card companies who continue to write-off (charge-off) seriously delinquent credit card debts. 

It is interesting to see how consumer debt, particularly credit card debt, has reached post-Great Recession highs and how consumer credit inquiries are up.  It appears that the current and prolonged low interest rate environment has lulled consumers into a false sense of credit reality.  As we can see on this graph from FRED, the current average interest rate of 12.31 percent on commercial bank credit cards is among the lowest in the last two plus decades:


It will be interesting to see how quickly consumer credit delinquency rates begin to rise once the Federal Reserve begins to normalize its monetary policies if, indeed, it does.

Friday, May 1, 2015

The Consumer Debt Trap

The latest version of the Household Debt and Credit Report from the New York Federal Reserve Bank shows that household debt levels continue to rise, reaching their highest level in the fourth quarter of 2014 since the Great Recession.

Here is a graph showing total household debt, broken down into both non-housing debt (in red) and housing debt (in blue):


In the fourth quarter of 2014, total household indebtedness was $11.83 trillion, up $117 billion from the third quarter but still below the third quarter of 2008 when household debt hit a peak of $12.68 trillion.

Here is a further breakdown of debt types:


The largest component of household debt is mortgage debt; overall mortgage debt balances reached $8.17 trillion, up 0.5 percent from the previous quarter.  Non-housing debt balances increased to $3.15 trillion, up 2.6 percent from the previous quarter.  Student loan debt balances increased to $1.16 trillion, up $31 billion from the previous quarter.

One debt area that has seen significant growth is auto loans.  As shown on this graph, during 2014, the value of newly originated auto loans (in red) has reached levels not seen since 2005 - 2006:


In contrast, the value of newly originated mortgages (in blue) has fallen well below levels seen in 2012 and 2013 and remains at levels that are quite low by historical standards.

Now, let's look at the loan delinquency statistics.  Here is a graphic showing the total percentage of loans that are delinquent as well as those that are current (in dark green):


It is interesting to see that, at 6 percent, the percentage of loans that are delinquent is still significantly higher than it was prior to the Great Recession.   About $710 billion of outstanding consumer debt was considered delinquent in the fourth quarter of 2014 and, of that, $507 billion is seriously delinquent.  As well, during the fourth quarter of 2014, 268,000 American consumers had a bankruptcy notification added to their credit reports.

Here is a breakdown of loan types and what percentage were 90 days or more delinquent in the fourth quarter of 2014 and how the percentages compare to the previous quarter:

Mortgage delinquencies: 3.1 percent (down from 3.2 percent)
Student loans: 11.3 percent (up from 11.1 percent)
Auto loans: 3.5 percent (up from 3.1 percent)

Here is a graphic showing the volume of new seriously delinquent loans by type for the fourth quarter of 2014:


Now, let's look at a couple of debt problem areas.  

1.) Student Loans:  The most obvious change over the past few years has been the growth in the level of seriously delinquent student loans which, as I noted above, has now reached 11.3 percent.  This is problematic because, after mortgages, student loans make up the biggest fraction of total consumer loans.  What is of even greater concern is that the Fed's delinquency rate for student loans probably understates the real scope of the problem since about half of the student loans are still in deferment, the grace period that temporarily removes them from having to make payments.  According to the St. Louis Federal Reserve Bank, the total student loan delinquency problem (i.e. delinquencies of all types) is even worse as shown on this graphic:


In the fourth quarter of 2014, 17.9 percent of student loans were 30 days or more delinquent.  This will have long-term repercussions for the U.S. economy since many of these younger Americans will enter the housing market much later than their older counterparts.

2.) Credit Card Debt:  Another concerning factor about consumer debt is the growth in credit card debt.  Here is a graph showing the annual net growth in consumer credit card debt for the years between 2009 and 2014:


According to CardHub, consumers ended up 2014 with a $57.1 billion net gain in credit card debt, the highest annual increase since the Great Recession.  The average household's credit card balance was nearly $7200 at the end of 2014, very close to the tipping point of $8300, the danger level defined by CardHub as being unsustainable.  One thing that is lulling consumers into higher levels of credit card debt is low interest rates.  As shown on this graph, at 11.8 percent, the interest rate on consumer credit cards is just above the lowest levels that have been seen over the past two decades:


Thanks to the Federal Reserve, the lengthy period of ultra-low interest rates has lulled American consumers into what could prove to be a very painful debt trap.  While consumer debt delinquency rates are below their Great Recession highs, they are still quite elevated compared to the years before 2008 and any increase in interest rates on the growing levels of outstanding consumer debt could prove to be very painful to America's consumer-driven economy.

Monday, April 29, 2013

America's Indebted Consumers - An Explanation for Poor Economic Growth


Consumer spending is the driver behind economic growth in today's economy.  Since consumer spending in the U.S. makes up roughly 70 percent of GDP (including spending on health care), rises and falls in spending by Main Street has a significant impact on overall economic growth.  

According to the Bureau of Economic Analysis, real personal consumption expenditures (PCE) increased by 3.2 percent in the first quarter of 2013 compared to 1.8 percent in the fourth quarter of 2012.  The biggest increase was seen in the purchase of durable goods, up 8.1 percent in Q1, down from an increase of 13.6 percent in Q4 2012.  It's buy, buy, buy time as you'll see on the next graph.

Here's a graph from FRED showing how real PCE has performed since just before the beginning of the Great Recession:


Here is a graphic from the Federal Reserve Bank of New York showing how household debt levels have changed over the past eight years:


While household debt has decreased from its peak of $12.64 trillion in the third quarter of 2009, it still stands at a whopping $11.34 trillion when both housing and non-housing debt is included.  Note that while housing debt levels have dropped, non-housing debt levels have remained consistently high and , for the first time since 2008, have grown by $31 billion in the last quarter of 2012.  This explains the growth in personal consumption expenditures noted above.  

Here is an even more detailed breakdown of what American consumers are using credit for:


Now for the bad news.  Here is a graph showing which types of loans are delinquent:


Lastly, here is a graph showing the percentage of loans based on their delinquency status:


While the percentage of loans that are 120 plus days or more overdue has dropped since the depths of the Great Recession, over 6 percent of borrowers still find themselves in credit hell, only slightly better than the 7.5 percent at the depths of the consumer credit crisis and well above historical norms.

With an elevated number of American consumers still finding themselves with credit difficulties, perhaps we have an explanation for the rather lukewarm GDP growth numbers four years into the "recovery".  What is particularly concerning is that once interest rates begin their march back to historical levels, American consumers will find that they simply cannot afford to buy, buy, buy.

Friday, December 14, 2012

The Looming Consumer Fiscal Cliff


A paper titled "How to Predict the Next Financial Crisis" by Steve Clemons and Richard Vague provides us with insight relating the level of private debt to the overall health of the economy and how the fiscal cliff that should be of greatest concern is one that is related to private debt levels.

The Great Recession resulted from a huge increase in consumer indebtedness, particularly mortgage debt.  In six short years, mortgage debt grew by 98 percent as shown on this chart: 


Although there has been modest improvement, total private debt has declined by only 3 percent since the Great Recession and is once again beginning to grow.  In case you were wondering, during the period from 1997 to 2007, population in the U.S. grew by 10 percent and was accompanied by a 41 percent increase in total private loans.  Borrowing growth really did outstrip population growth.

If we look back in time for comparison's sake, mortgage debt as a percentage of GDP grew by 16 percent from 1960 to 2000.  This rose to 68 percent between 2000 and 2010, an excess of $2.5 trillion in mortgages over the previous 40 year trend line, yet another expression of just how overly indebted consumers have become in this new reality of ours.  

By one measure, the Great Depression and Great Recession had one thing in common; private debt-to-GDP ratios grew very rapidly in the decade preceding the crisis (45 percent and 40 percent respectively) to the point where the ratio exceeded 150 percent.  The authors note that it is this buildup of private debt levels can be used to predict the onset of a significant economic contraction.

This is what private debt-to-GDP trends looked like prior to and during the Great Depression (in blue) and Great Recession (in red):


It is the rapid growth in debt levels that would appear to be the key factor in signalling an economic crisis.

The buildup of private debt prior to the Great Depression and its subsequent 22 percent reduction resulted in a massive 45 percent contraction in GDP; as indebted consumers began to pay down their debt using dollars that would otherwise be used for spending or investment, they stopped stimulating the economy through consumption of goods and services.  During the Great Recession, private debt decreased by only 3 percent and GDP contracted by 3 percent, a far cry from what happened during the Great Depression in both cases.  This resulted in the Great Recession being a walk in the park compared to what happened to Americans during the Great Depression.

We are being exposed to news about government debt and deficit levels and the fiscal cliff on a daily basis.  Here is a bar graph that compares the private and public debt-to-GDP levels showing the imprudence of consumers:


Lastly, here is a bar graph showing the private debt-to-GDP levels from 1916 to 2011:


You can see the rapid rise in the debt-to-GDP ratio during the 1920s as it roared past the 150 percent mark and how sharply it fell during the early 1930s (i.e. a consumer fiscal cliff).  A similar debt buildup took place during the late 1990s and early part of the new millennium as, once again, the ratio passed the 150 percent mark, however, this time, it was not followed by a sharp consumer fiscal cliff.  Is that yet to come?  Since consumers did not pay down their debt levels during the Great Recession as they did during and after the Great Depression, is the other shoe about to drop since potentially crippling high private debt levels are still in place.   You will also notice that after World War II, the private debt-to-GDP levels were at a very low level after the system "cleansed itself".  This low private debt level enabled the parents of the baby boomer generation to massively stimulate the economy through the purchases of homes, cars and other consumer goods as they established their families.  This is quite clearly not the case today.

The authors conclude that because of its sheer size, the growth and contraction of private debt may be more important in determining the future trend of the economy and future economic crises than money supply, government debt, trade, tax, reserve requirements and other factors.  American consumers who are most likely to borrow to consume are those that generally drive the majority of consumption in the economy and when their ability to borrow more to consume more is affected, the negative impact on economic growth is amplified.  That could well be a fiscal cliff that is even more threatening to America's economic well-being that the one being manufactured by Washington.  Perhaps Mr. Bernanke and his Federal Reserve Bank buddies should also take note.  There really is a price to pay for "easy credit" and it's a painful one, particularly when that credit has been a bit too easy to obtain.